PKR ends 2025 weaker against USD

MG News | December 31, 2025 at 03:57 PM GMT+05:00

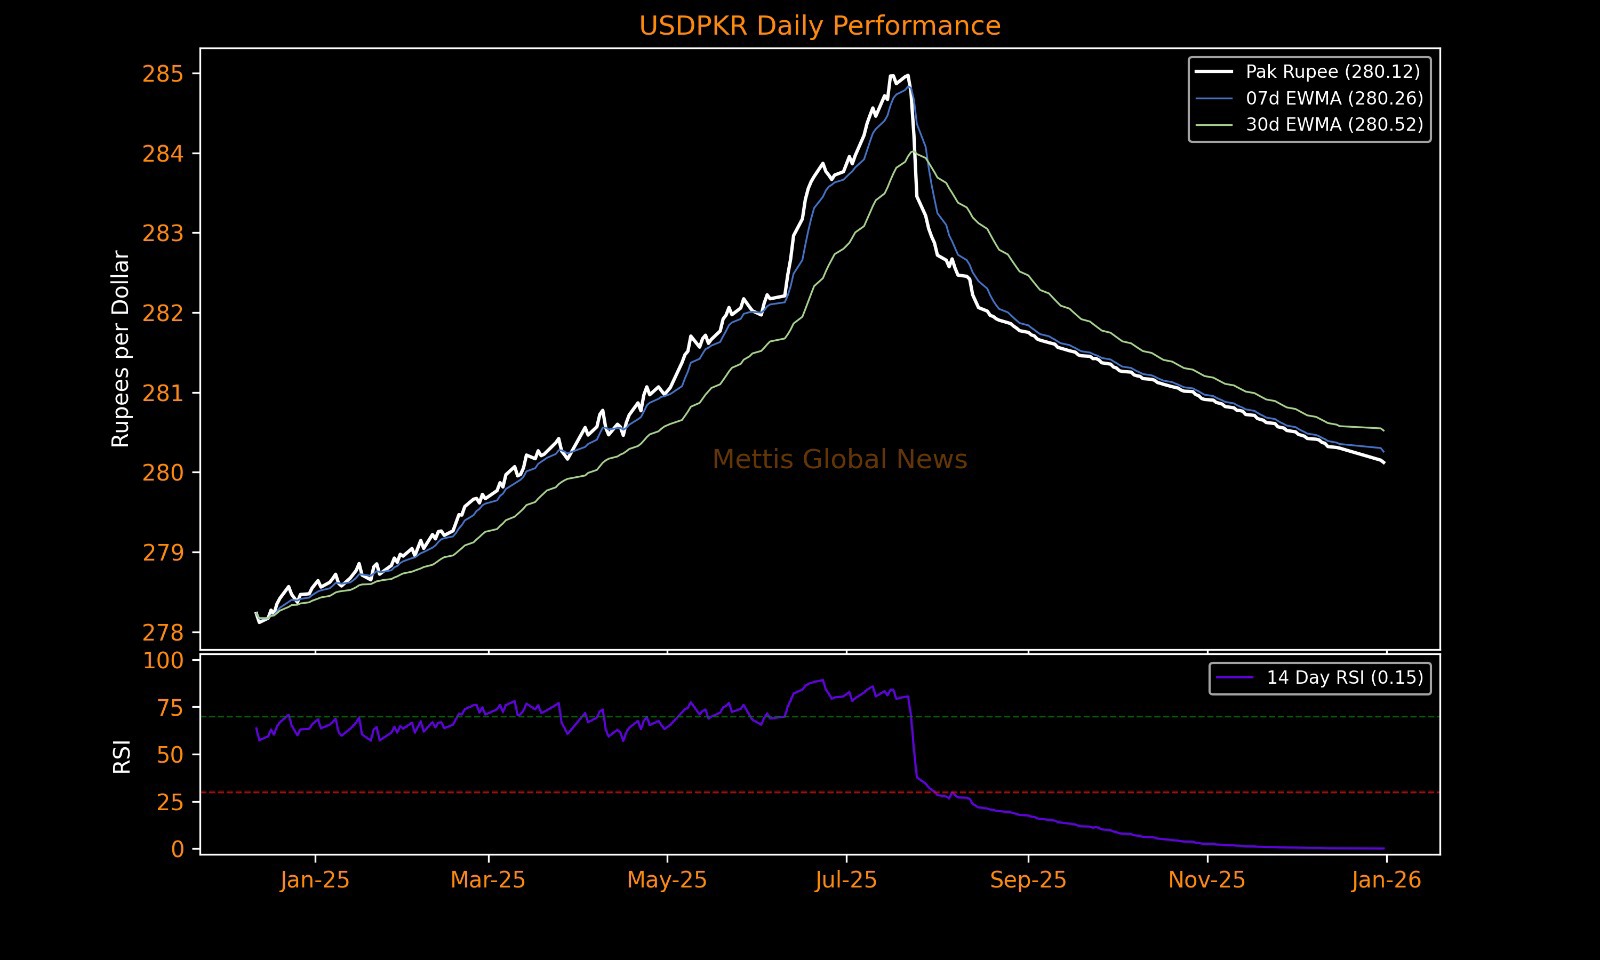
December 31, 2025 (MLN): The Pakistani rupee (PKR) closed 2025 at 280.1231 against the US dollar at the end of the year, depreciating by 1.57 paisa, or around 0.56%, compared with last year’s closing level of 278.55 per USD.
However, the currency appreciated by 40 paisa, or around
0.14%, from 280.5231 at the end of last month.
It also posted a day-on-day appreciation of 2.84 paisa, or nearly 0.01%, from the previous session’s close of 280.1515 in the final trading session.
Throughout the day, the currency saw an intraday high (bid) of 280.40 and a low (ask) of 281.15.
In the open market, exchange companies quoted the dollar at 280.50 for buying and 281.20 for selling.
In comparison to major currencies, PKR gained 78.98 paisa or 0.24% against the Euro, closing at 328.85 compared to the previous value of 329.64.
Against the British Pound, PKR increased by 1.27 rupees or 0.34% to 377.17 compared to 378.44 a day ago.
The local unit rose 1.76 rupees or 0.50% against Swiss franc to close at 353.22.
Against the Japanese Yen, PKR's value rose 0.76 paisa or 0.42% to close the session at 1.7892 versus 1.7968 a day ago.
Pakistani Rupee deteriorated 0.05 paisa against Chinese Yuan to close at 40.07 from 40.07.
The local currency deteriorated by 0.34 paisa against Saudi Riyal to 74.69. While it increased by 0.56 paisa or 0.01% against the U.A.E Dirham to close at 76.28.
During the current fiscal year, PKR has increased against the US Dollar by 3.64 rupees or 1.30%. While it has weakened 1.57 rupees or 0.56% so far this calendar year.
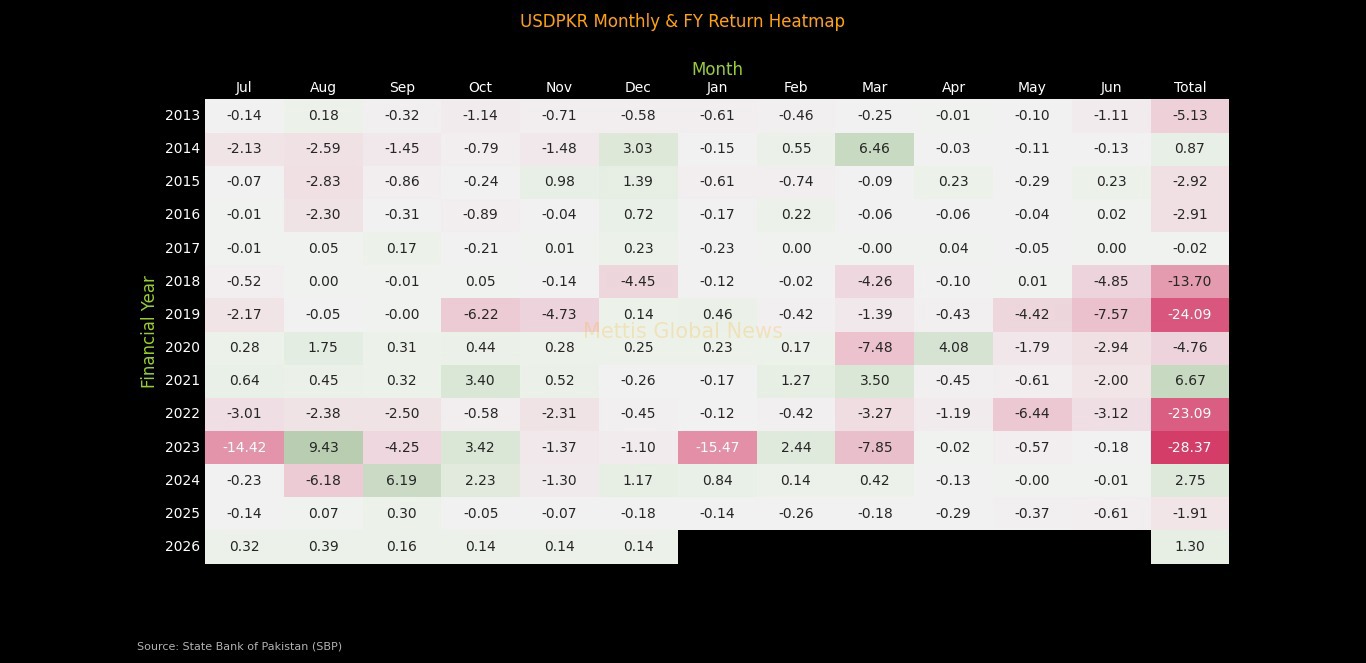
This heatmap presents monthly percentage changes in USD/PKR across financial years, illustrating periods of rupee appreciation (green) and depreciation (red).
Key Value-Based Observations:
FY2019 was one of the worst years for the rupee, with a total depreciation of -24.09%, driven by sharp monthly losses such as -6.22% in October, -4.73% in November, -4.42% in May, and -7.57% in June.
FY2022 recorded a cumulative -23.09% decline, with heavy pressure in July (-3.01%), August (-2.38%), September (-2.50%), and May (-6.44%), reflecting widening external imbalances.
FY2023 marked the most volatile phase, posting a -28.37% annual fall.
The year included an extreme -15.47% move in January, alongside -14.42% in July and -7.85% in March, highlighting the impact of exchange-rate liberalization and severe FX shortages.
In contrast, FY2021 closed with a +6.67% annual gain, supported by positive months such as October (+3.40%), February (+1.27%), and March (+3.50%), indicating relative currency stability.
FY2024 shows signs of stabilization, ending +2.75% for the year, with notable appreciation in September (+6.19%) and October (+2.23%), offsetting weaker months like August (-6.18%).
FY2025 reflects contained volatility, with most monthly changes ranging between -0.61% and +0.30%, resulting in a -1.91% cumulative move, suggesting tighter FX management.
FY2026 (partial) currently shows modest gains, totaling +1.30%, with monthly appreciation clustered around +0.14% to +0.39%, pointing to continued stability.
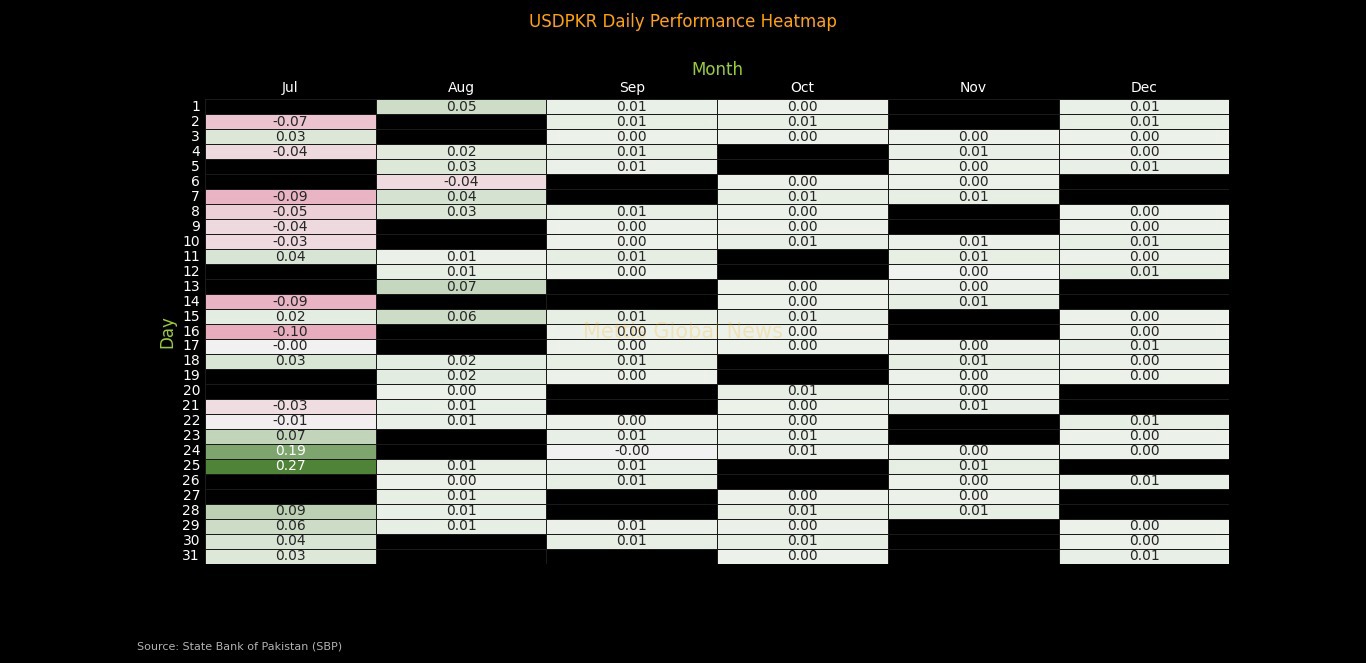
The USD/PKR exchange rate showed a clear shift from volatility to stability during the July–December period.
In July, the rupee experienced relatively sharp daily movements, with notable gains and losses throughout the month.
The largest appreciation was recorded on July 25, when the rupee strengthened by 0.27 percent, followed by another strong move of 0.19 percent on July 24.
On the downside, the steepest daily depreciation in July was seen on July 16, when the rupee weakened by 0.10 percent, while several other days posted declines in the range of 0.05 to 0.09 percent, reflecting heightened market volatility.
In contrast, August marked a phase of moderation, with most daily changes confined to a narrow band between 0.00 and 0.07 percent.
The strongest movement during the month was observed on August 13, when the rupee depreciated by 0.07 percent, while the majority of sessions recorded marginal fluctuations of 0.01 to 0.03 percent, indicating a more balanced foreign exchange market.
Stability became more pronounced in September, as daily movements largely hovered around 0.00 to 0.01 percent.
The pattern of subdued volatility persisted through November and December, with daily movements predominantly capped at 0.01 percent and several sessions showing no change at all.
December, in particular, reflected one of the most stable periods, as nearly all recorded values ranged between 0.00 and 0.01 percent, highlighting a marked reduction in speculative activity.
Performance Summary
| Currency | Dec 31, 2025 | Dec 30, 2025 | 1D | 7D | 1M | FYTD | CYTD | |||||
|---|---|---|---|---|---|---|---|---|---|---|---|---|
| USD | 280.1231 | 280.1515 | 0.0284 | 0.01% | 0.1787 | 0.06% | 0.4000 | 0.14% | 3.6414 | 1.30% | -1.5731 | -0.56% |
| EUR | 328.8505 | 329.6403 | 0.7898 | 0.24% | 0.6303 | 0.19% | -4.1590 | -1.26% | 3.8066 | 1.16% | -38.7685 | -11.79% |
| GBP | 377.1718 | 378.4427 | 1.2709 | 0.34% | -1.7636 | -0.47% | -6.5587 | -1.74% | 11.6848 | 3.10% | -27.4662 | -7.28% |
| CHF | 353.2226 | 354.9817 | 1.7591 | 0.50% | -1.2836 | -0.36% | -5.1790 | -1.47% | 2.1048 | 0.60% | -44.7849 | -12.68% |
| JPY | 1.7892 | 1.7968 | 0.0076 | 0.42% | 0.0209 | 1.17% | 0.0052 | 0.29% | 0.1808 | 10.11% | -0.0058 | -0.32% |
| SAR | 74.6945 | 74.6911 | -0.0034 | -0.00% | 0.0228 | 0.03% | 0.0827 | 0.11% | 0.9659 | 1.29% | -0.5529 | -0.74% |
| AED | 76.2759 | 76.2815 | 0.0056 | 0.01% | 0.0465 | 0.06% | 0.1016 | 0.13% | 0.9915 | 1.30% | -0.4397 | -0.58% |
| CNY | 40.0728 | 40.0723 | -0.0005 | -0.00% | -0.2688 | -0.67% | -0.4391 | -1.10% | -0.4694 | -1.17% | -1.9113 | -4.77% |
52 Week Performance
| Currency | High | Low | Trading Band | % Since High | % Since Low | High Date | Low Date | Days Since High | Days Since Low |
|---|---|---|---|---|---|---|---|---|---|
| USD | 278.5500 | 284.9710 | 6.4210 | -0.56% | 1.73% | 31-Dec-24 | 22-Jul-25 | 365 | 162 |
| EUR | 284.6665 | 335.1574 | 50.4909 | -13.44% | 1.92% | 13-Jan-25 | 03-Jul-25 | 352 | 181 |
| GBP | 338.2418 | 390.0418 | 51.8000 | -10.32% | 3.41% | 13-Jan-25 | 26-Jun-25 | 352 | 188 |
| CHF | 303.4906 | 359.7698 | 56.2792 | -14.08% | 1.85% | 03-Feb-25 | 23-Jul-25 | 331 | 161 |
| JPY | 1.7586 | 1.9999 | 0.2413 | -1.71% | 11.78% | 10-Jan-25 | 22-Apr-25 | 355 | 253 |
| SAR | 74.1416 | 75.9801 | 1.8385 | -0.74% | 1.72% | 31-Dec-24 | 16-Jul-25 | 365 | 168 |
| AED | 75.8362 | 77.5864 | 1.7502 | -0.58% | 1.72% | 31-Dec-24 | 22-Jul-25 | 365 | 162 |
| CNY | 37.9910 | 40.0728 | 2.0818 | -5.20% | 0.00% | 10-Jan-25 | 31-Dec-25 | 355 | 0 |
Copyright Mettis Link News
Related News
.jpg_20260429074410761_cd3be6.jpeg?width=280&height=140&format=Webp)

| Name | Price/Vol | %Chg/NChg |
|---|---|---|
| KSE100 | 178,356.67 78.75M | 1.28% 2262.55 |
| ALLSHR | 107,774.94 256.98M | 1.17% 1244.05 |
| KSE30 | 53,211.53 34.49M | 1.39% 731.31 |
| KMI30 | 250,888.27 36.78M | 1.49% 3690.21 |
| KMIALLSHR | 69,030.67 117.07M | 1.25% 852.13 |
| BKTi | 50,920.31 9.66M | 1.19% 601.14 |
| OGTi | 34,890.68 2.84M | 1.67% 574.21 |
| Symbol | Bid/Ask | High/Low |
|---|
| Name | Last | High/Low | Chg/%Chg |
|---|---|---|---|
| BITCOIN FUTURES | 62,950.00 | 63,970.00 62,430.00 | -180.00 -0.29% |
| BRENT CRUDE | 83.15 | 84.55 81.55 | -4.78 -5.44% |
| RICHARDS BAY COAL MONTHLY | 107.75 | 0.00 0.00 | -0.50 -0.46% |
| ROTTERDAM COAL MONTHLY | 121.60 | 0.00 0.00 | -0.40 -0.33% |
| USD RBD PALM OLEIN | 1,175.00 | 1,175.00 1,175.00 | 0.00 0.00% |
| CRUDE OIL - WTI | 79.41 | 81.30 78.78 | -5.26 -6.21% |
| SUGAR #11 WORLD | 14.65 | 0.00 0.00 | -0.01 -0.07% |
Chart of the Day
Latest News
Top 5 things to watch in this week
Pakistan Stock Movers
| Name | Last | Chg/%Chg |
|---|
| Name | Last | Chg/%Chg |
|---|