
AI Economy to hit $3tr by 2030

MG News | July 06, 2026 at 10:45 AM GMT+05:00

July 06, 2026 (MLN): Global AI revenues are projected to reach $3.1tr by 2030, split across an application layer of co-pilots, agents and customer service tools worth $990bn, an intelligence layer of text, image and video models worth $495bn, and an enabling layer of GPUs, memory, data centre infrastructure and cloud worth $1.65tr.
AI adoption and monetization continue to accelerate and
justify the scale of capital spending already underway. This is according to
"The AI Economy: A Roadmap," a report by UBS Chief Investment
Office's Jason Draho, Andrew Dubinsky and Paul Hsiao.
Employment growth for workers aged 22-25 in roles with high
AI exposure contracted by roughly 7% between the fourth quarter of 2022 and the
fourth quarter of 2025, even as their low-exposure peers in the same age
bracket grew nearly 12% over the same period.
Every other age cohort recorded positive employment growth
regardless of exposure level, making young workers the clearest casualty of AI
adoption so far.
Part of the divergence may be tied to a decline in remote,
AI-exposed entry-level positions rather than automation alone, based on
separate research into remote-work patterns and youth unemployment.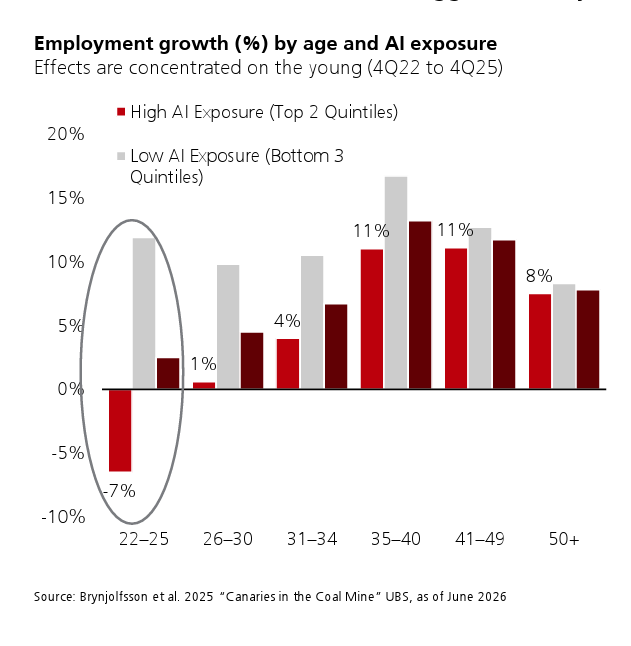
Workplace use of artificial intelligence has crossed 40% and
is rising at roughly 11 percentage points a year, a pace ahead of both the
personal computer and the internet at the same stage after their mass
introduction.
About 13% of workers are now everyday AI users, up 2
percentage points year-on-year, while firm-level adoption stands near 20% on a
count-weighted basis, led by large firms and by information technology,
finance, and professional services industries.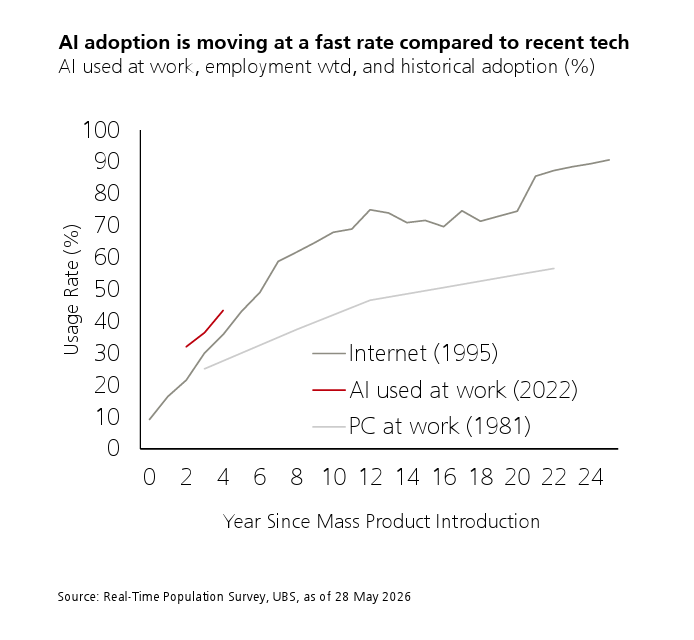
The eventual labour market impact of AI depends on four
linked factors: how many tasks are exposed to AI tools, how quickly firms adopt
them, and whether the technology substitutes for or augments workers.
Estimates of job-level automation risk vary widely by
methodology, ranging from 4% of jobs under a framework combining high AI
exposure with low adaptive capacity, to as much as 19% when considering both
current and anticipated tools with 50%-plus task exposure.
Exposure is highest in computer/math occupations, followed
by sales, business, and office/administrative roles, and rises with educational
attainment: median exposure among jobs requiring a college degree is 45%, more
than triple the 14% median for jobs that do not require one.
Despite that exposure, business surveys indicate AI is still
overwhelmingly supplementing rather than replacing labour. 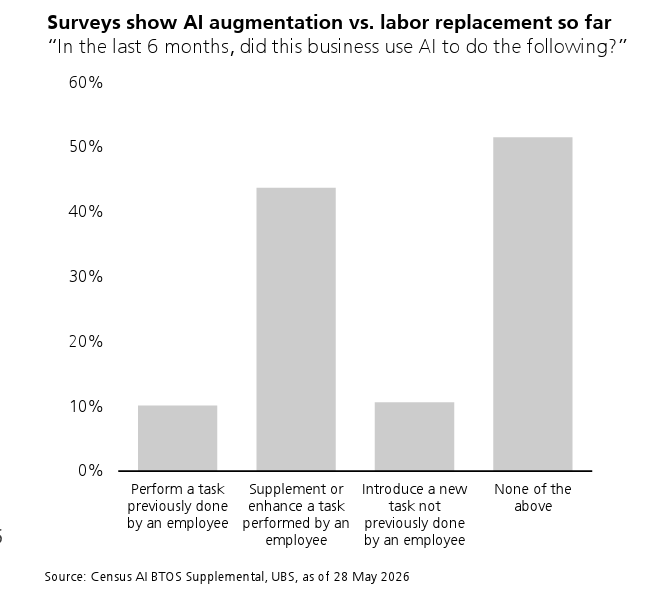
Asked whether AI had been used in the last six months to
perform a task previously done by an employee, only about 10% of firms said
yes, compared with roughly 44% reporting it was used to supplement or enhance
an existing task, and just over half reporting no use at all.
The correlation between AI adoption or exposure and job growth has been low in aggregate: AI-exposed technology employment has been falling relative to private service-sector jobs excluding healthcare and AI-tech, while employment in AI-exposed construction categories tied to data centre build-out has been growing faster than the rest of the construction sector.
Total factor productivity growth has typically added to
aggregate labour demand through final-demand and upstream effects that outweigh
direct labour displacement, and periods of strong productivity growth,
including the late-1990s IT integration era that averaged 2.5% annual
productivity growth, have been neutral to positive for real worker
compensation, according to OECD-based research cited in the report.
Behind the labour market data sits an investment cycle the
report describes as an AI "flywheel": productivity gains drive
adoption, adoption lifts compute demand, compute demand requires capex, and
falling costs from that capex unlock further use cases, restarting the cycle.
Energy supply and financing access are identified as the two most likely
constraints on the loop.
Hyperscaler capital expenditure across AWS, Google, Meta,
Microsoft, Oracle and Tier 2/neocloud providers is forecast to exceed $5tr
cumulatively by 2030, with AI-related capex now accounting for a growing share
of total US fixed investment and technology-sector capex rising to roughly 37%
of total S&P 500 capital spending. 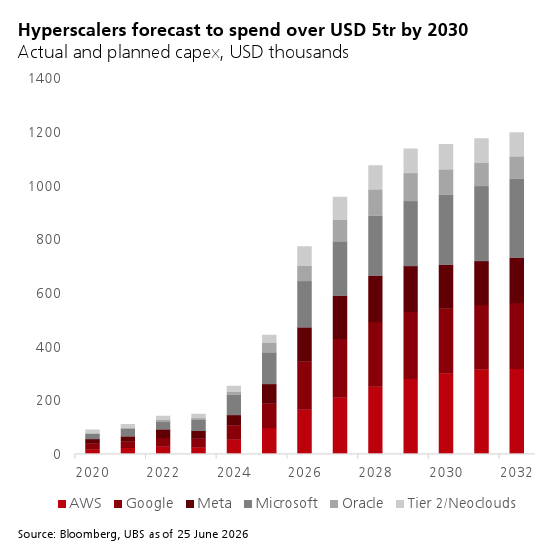
Financing this build-out is drawing on the full capital
structure, from free cash flow and public equity down to private credit and
infrastructure funds, with big-five hyperscaler senior unsecured bond issuance
surging past $150bn in 2026.
Data centre energy demand is expected to rise from 44
gigawatts in 2025 to 156 gigawatts by 2030, with associated energy investment
estimated at $300bn in a base case, ranging from $200bn in a bear scenario to $600bn
in a bull scenario. 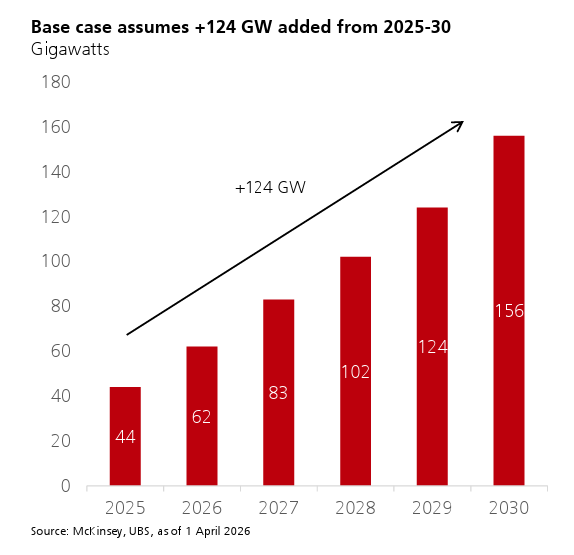
Token usage, the basic unit of AI compute, has risen from
near zero in October 2024 to nearly 8tr tokens by late 2025, with enterprise
adoption governed by a straightforward cost-benefit calculation between the
price of running AI models and the value of time saved on tasks.
AI's ultimate transformation of the economy hinges on the
size of the productivity gains it can generate, since the same level of
adoption produces a larger GDP boost the bigger those gains are.
US labour productivity has grown at 2.7% annualised over the
past three years, more than a percentage point above the 2010s average, though
the gain is attributed mainly to post-pandemic normalisation rather than AI,
since adoption rates and efficiency gains have so far been too small to explain
the increase.
Academic studies of AI's effect on task-level productivity
find gains of roughly 25-30% across functions including coding, professional
writing, customer service and business consulting, but translating these
micro-level gains into macroeconomic productivity growth is contested.
Estimates of the aggregate annualised boost range from as
low as 0.1 percentage points to as high as 2.8% points across separate studies
by the OECD, IMF and Goldman Sachs.
Two distinct effects are possible: improved worker
efficiency, considered highly likely, would level-shift output higher without
permanently raising the productivity growth rate, while a boost to the pace of
innovation itself, considered less likely, would sustainably raise the growth
rate rather than simply shifting the output level.
The scale of any GDP effect is highly sensitive to
assumptions about adoption timelines and efficiency gains: annual GDP growth
effects range from as low as 0.5% under a 20-year adoption timeline to 2.3%
under a 10-year timeline with high exposure and efficiency gains.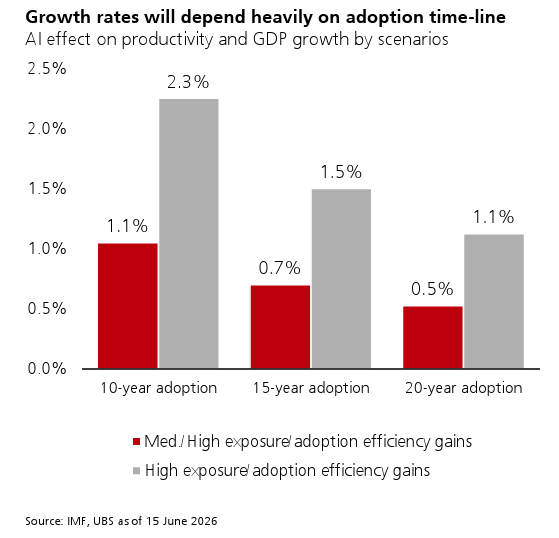
AI is currently lifting both growth and inflation, keeping
the macro regime in reflation as a byproduct, but its longer-run effect is
expected to shift toward disinflationary growth as productivity gains outweigh
the inflationary impulse from capex and input costs.
AI-related investment contributed an estimated 25 basis
points to GDP growth on average in 2025, though a substantial portion of that
capex is spent on imported chips and equipment, which drags on net exports and
reduced the net AI contribution to GDP to roughly zero over the course of 2025.
On inflation, AI is adding upward pressure in the near term
through three channels: rising prices for data centre inputs such as memory and
batteries, higher software and digital goods prices, with computer software and
accessories prices up 14% year-on-year, and increased electricity demand
pushing up utility costs faster than broader core inflation.
Medium to long term, these pressures are expected to ease as
high input prices incentivise supply expansion and productivity gains begin to
outweigh inflationary effects.
The impact on monetary policy is similarly two-sided.
Current growth and inflation impulses are keeping the Federal Reserve from
cutting rates as quickly as it otherwise might, while structural disinflation
and potential labour market weakening from AI displacement are reasons to
expect rate cuts further out.
On the neutral rate, higher productivity growth should raise
it, but increased AI-related labour market and income uncertainty could raise
household savings rates and reduce it, with the net effect assessed as likely a
modestly higher neutral rate depending on the pace of adoption.
On fiscal policy, a one-percentage-point AI productivity
shock could reduce the US deficit-to-GDP ratio by up to roughly 2 percentage
points and debt-to-GDP by up to 18 percentage points by 2035, though weaker
labour force participation could partly offset these gains.
Regulatory risk is also rising: survey data shows majorities
across generations, from 81% of Gen Z to 57% of the Silent Generation, believe
AI will reduce job opportunities, while opposition to local data centre
construction exceeds support across Republican, independent and Democratic
respondents alike.
AI is now treated as a macro factor affecting every asset
class rather than a standalone investment theme. In equities, a group of
AI-linked mega-cap names now makes up more than 30% of S&P 500 market
capitalisation, raising concentration risk, while a clear performance gap has
opened between perceived AI leaders and laggards.
In rates, AI capex is lifting growth and inflation in a way
that tilts the Federal Reserve toward hiking rather than cutting in the near
term, while long-end Treasury yields have historically fallen around major AI
model release announcements.
In credit, hyperscalers have issued more than $100bn of
investment-grade debt in 2026 alone, and high-yield technology sector spreads
have widened relative to the broader US corporate average as investors demand a
premium for financing the capex build-out.
In currencies, the US dollar has shown a strengthening
correlation with AI-linked equity performance, showing capital inflows tied to
US dominance in AI investment relative to China and the European Union.
In commodities, surging compute demand combined with limited
near-term supply flexibility has lifted industrial metals and energy prices, a
trend expected to continue as data centre energy usage rises more than fourfold
by 2030 relative to 2020 levels.
Copyright Mettis Link News
Related News
_20260421112347985_f8783f.jpeg?width=280&height=140&format=Webp)


| Name | Price/Vol | %Chg/NChg |
|---|---|---|
| KSE100 | 167,089.28 109.91M | -0.21% -352.63 |
| ALLSHR | 101,117.40 308.32M | -0.15% -155.10 |
| KSE30 | 49,841.71 50.59M | -0.28% -142.15 |
| KMI30 | 240,372.43 78.75M | -0.02% -45.72 |
| KMIALLSHR | 65,518.16 188.07M | -0.05% -35.70 |
| BKTi | 46,228.77 7.60M | -0.60% -281.04 |
| OGTi | 33,974.66 4.20M | -0.27% -91.31 |
| Symbol | Bid/Ask | High/Low |
|---|
| Name | Last | High/Low | Chg/%Chg |
|---|---|---|---|
| BITCOIN FUTURES | 83,505.00 | 84,320.00 82,645.00 | 1035.00 1.26% |
| BRENT CRUDE | 104.54 | 0.00 0.00 | -0.18 -0.17% |
| RICHARDS BAY COAL MONTHLY | 128.50 | 0.00 0.00 | 0.75 0.59% |
| ROTTERDAM COAL MONTHLY | 143.40 | 143.40 143.40 | -1.15 -0.80% |
| USD RBD PALM OLEIN | 1,167.50 | 1,167.50 1,167.50 | 0.00 0.00% |
| CRUDE OIL - WTI | 91.66 | 0.00 0.00 | -0.19 -0.21% |
| SUGAR #11 WORLD | 20.27 | 20.44 20.09 | 0.12 0.60% |
Chart of the Day
Latest News
Top 5 things to watch in this week
 PIB Auction
Pakistan Stock Movers
| Name | Last | Chg/%Chg |
|---|
| Name | Last | Chg/%Chg |
|---|