Tech Beat: KSE100 shows strong signals for 60,000
Abdur Rahman | October 16, 2023 at 07:52 AM GMT+05:00

October 16, 2023 (MLN): The KSE-100 index's new yearly high signals a robust bullish trend, with a projected target range of 60,000-64,000 based on Fibonacci extensions.
| Support Levels | ||
|---|---|---|
| 48,500 | 48,200 | 46,700 |
| S1 | S2 | S3 |
| Resistance Levels | ||
|---|---|---|
| 50,000 | 54,000 | 60,000 |
| R1 | R2 | R3 |
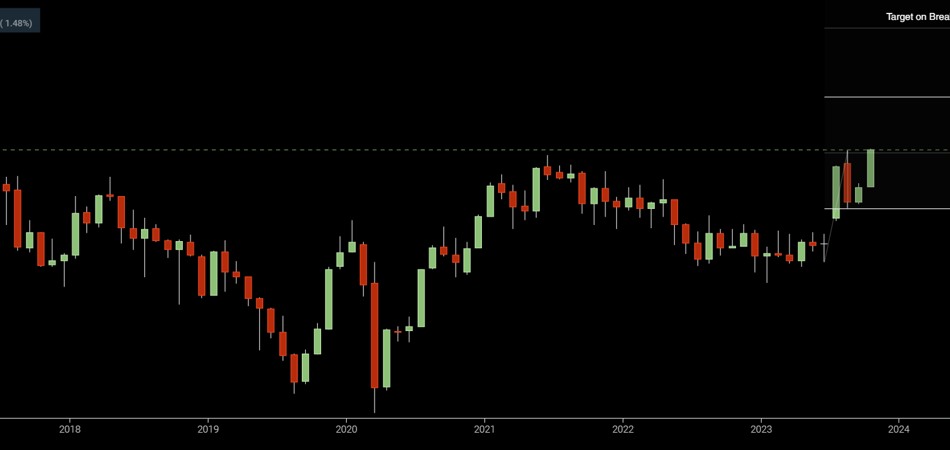
KSE-100 index, the benchmark for the Pakistan Stock Exchange (PSX) has made a new yearly high, indicating a strong bullish trend across all timeframes.
After hitting a peak of 49,404 in early August, the market entered a consolidation phase for ~2.5 months, ultimately forming a higher low at 44,460.
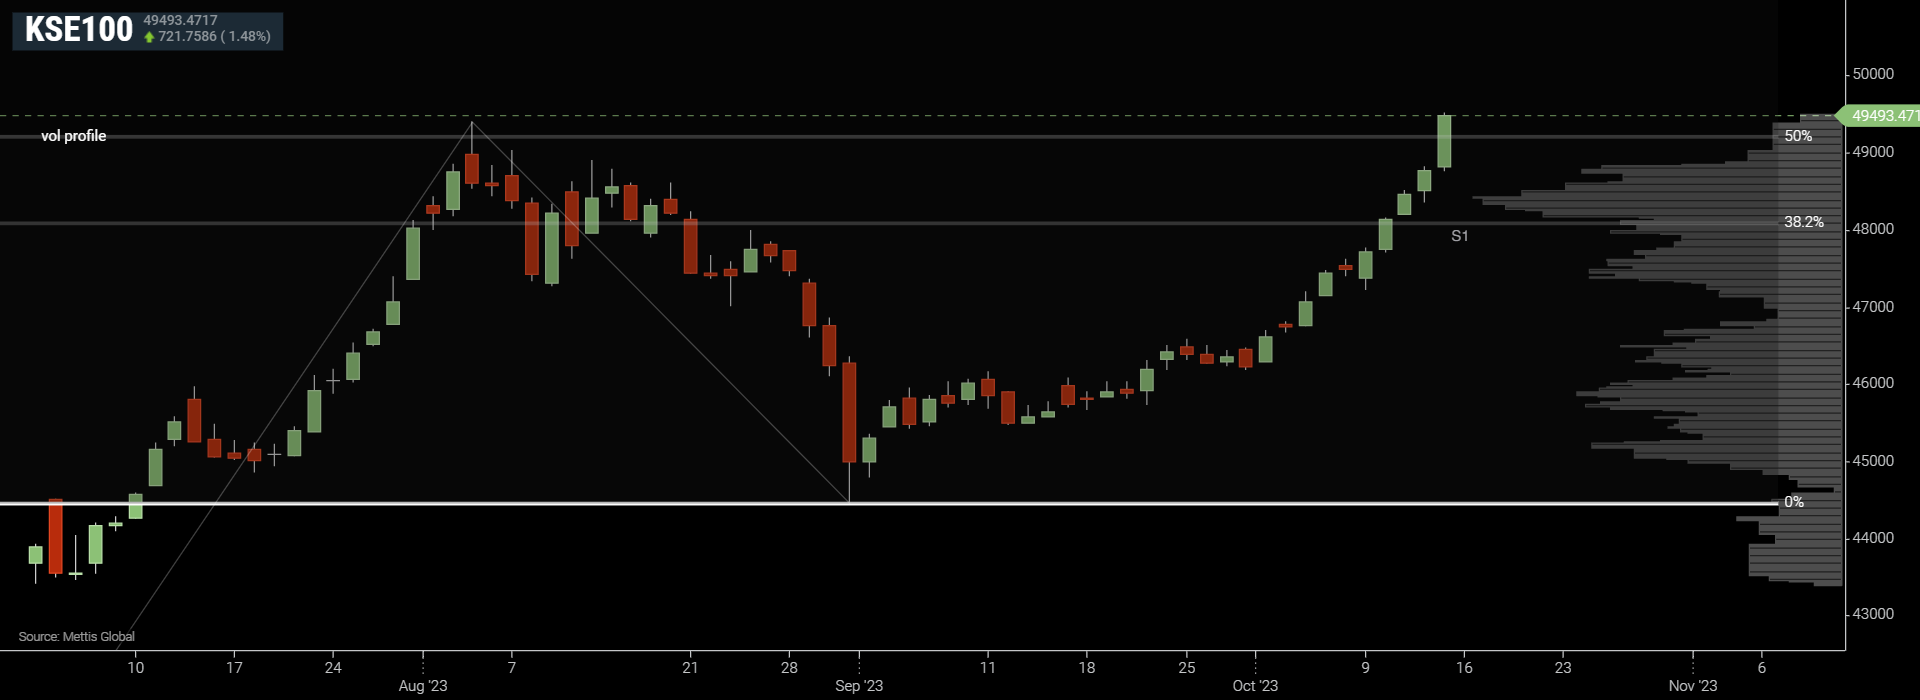
The market then resumed its upward momentum and broke above the yearly high, which had acted as a resistance level before. The index also closed above this level on a weekly basis.
To note, the 48,200-48,400 zone was a high-volume node, as it witnessed significant trading activity in July-August. The index managed to push through this zone which will now act as a strong support level if the market were to see any deep correction, although unlikely.
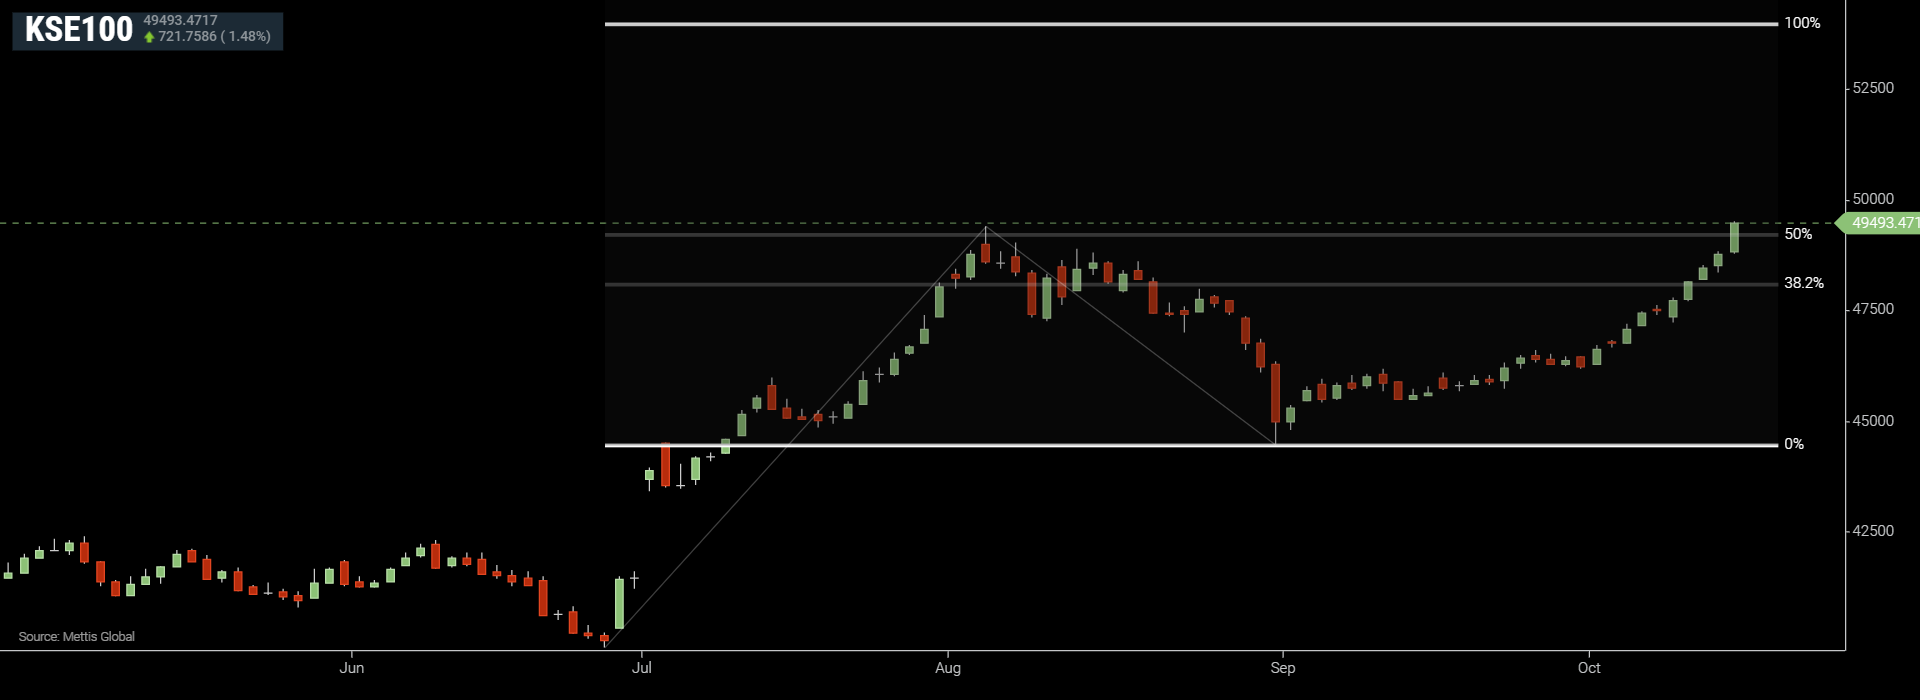
The ideal bullish scenario would be to see more buying pressure next week on open, followed by some correction leading to the formation of a higher low above the previous peak of 49,404.
This would be the previous yearly high and a potential demand zone, where the sellers who exited the market at these levels or lower would likely seek to re-enter.
This would create a bullish retest pattern before the market continues its uptrend.
Anticipating the next market movements, it is reasonable to project a target range between 60,000-64,000, which is based on Fibonacci extensions drawn from the recent highs and lows.
The weekly chart shows a clear and consistent uptrend, which supports the bullish outlook. There is no sign of reversal or weakness in the market. Zooming out helps to see the bigger picture and avoid being distracted by minor fluctuations. The market is still in a strong bullish phase.
KSE-100 Weekly time-frame chart
Scrips to Monitor
MCB
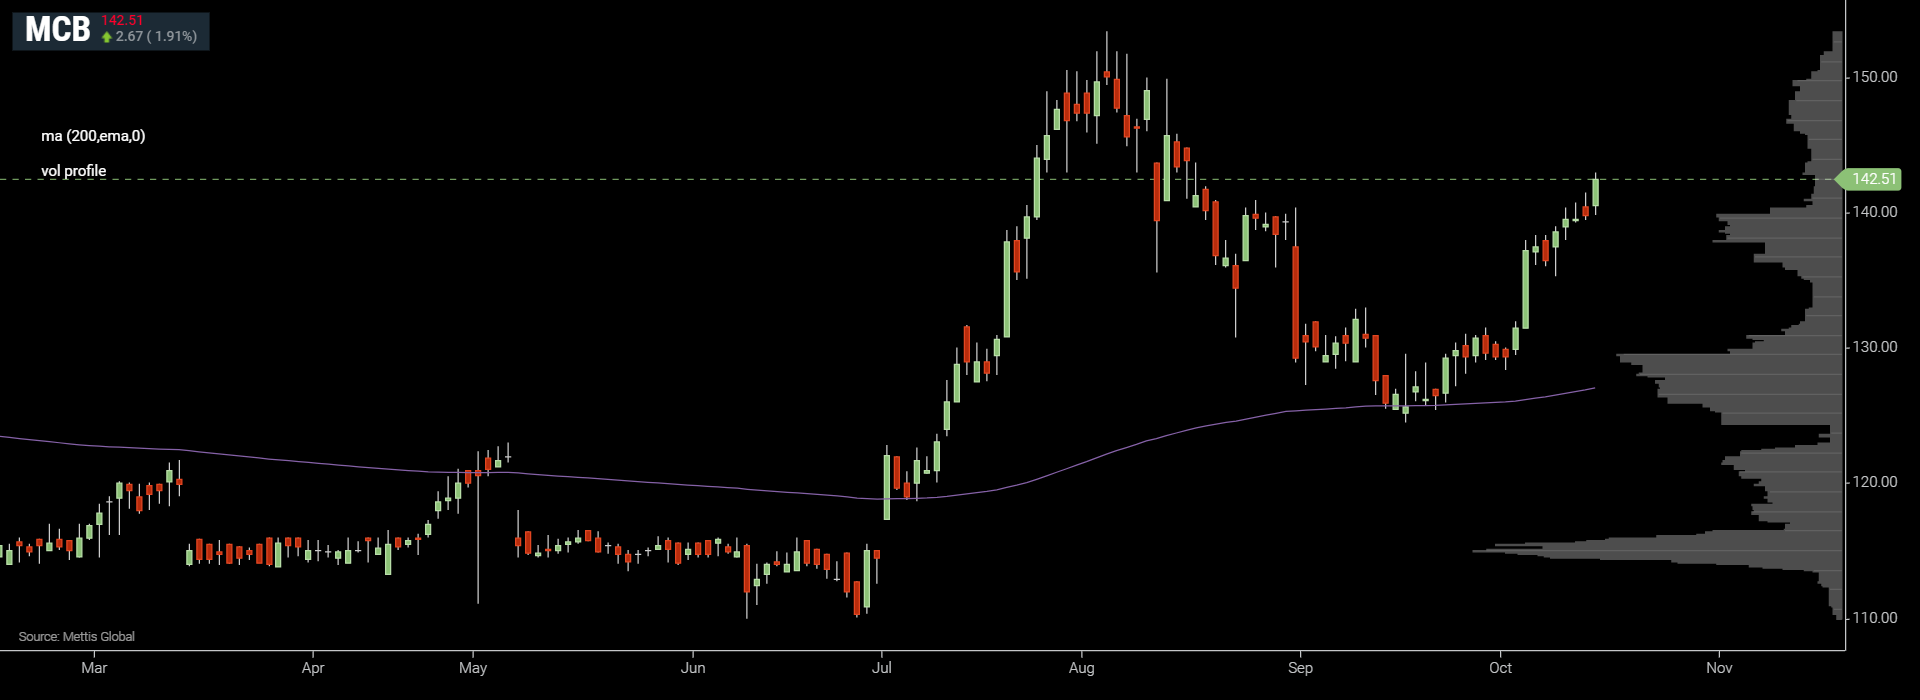
The banking sector appears favorable for further upward movement, with MCB garnering particular attention.
To note, MCB breached its 200-day Exponential Moving Average (EMA) earlier in June, marking the first such occurrence since February 2021 (for a sustained period).
Following this breakout, it retested this level in the previous month, successfully flipping this level into support.
In terms of technical levels, the range between Rs138 and Rs140 serves as a good support zone, offering upside targets towards ~Rs165s on a break of yearly highs.
HBL
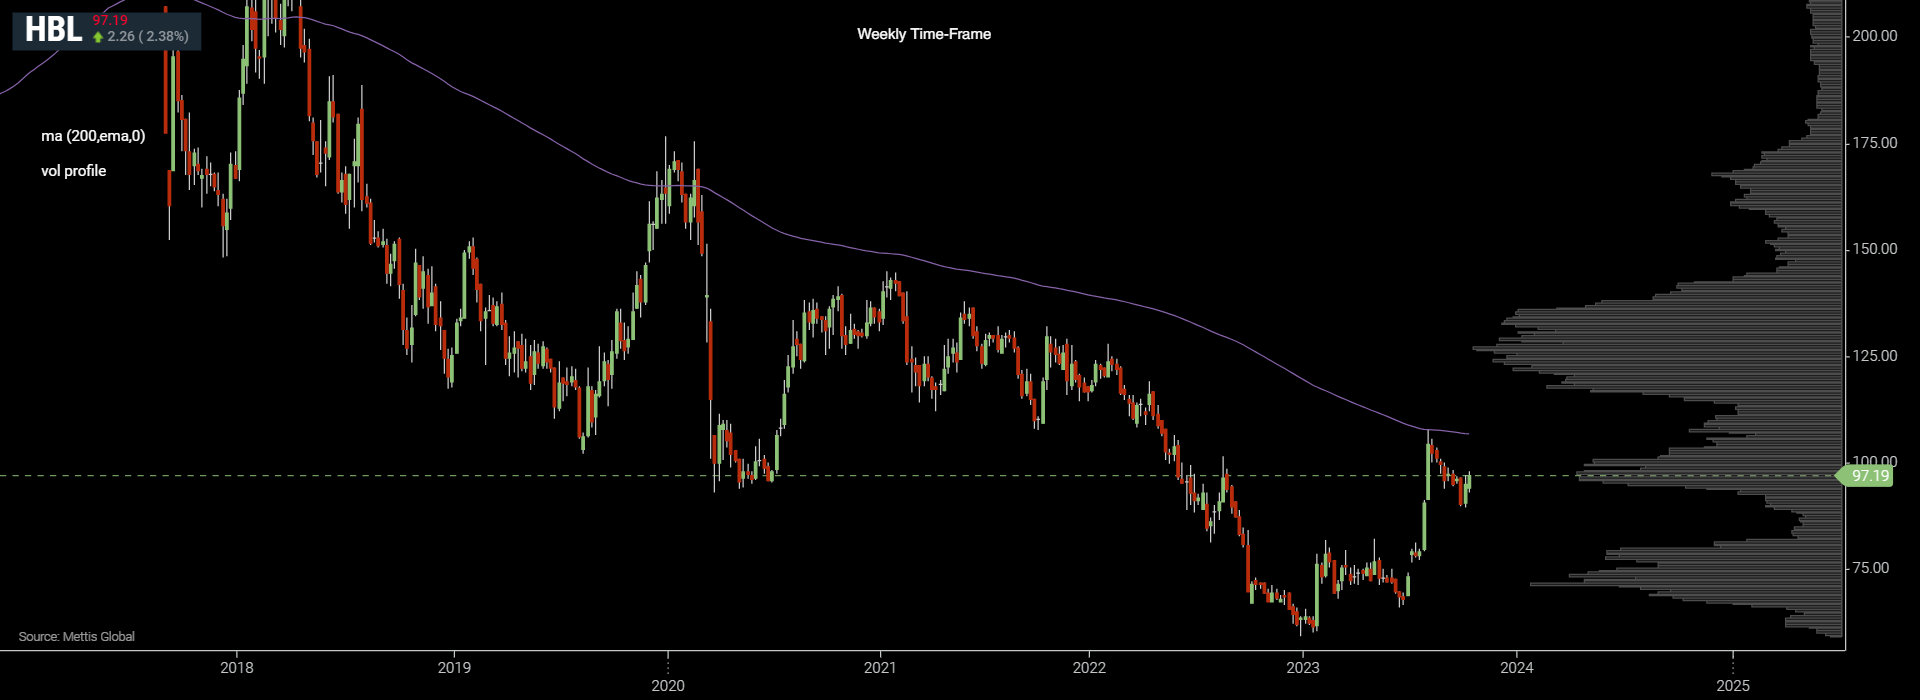
HBL closed right around its resistance of ~Rs97, a decisive breakthrough above this barrier would set the stage for a retest of the 200D EMA at ~Rs107.
Furthermore, surpassing the 200D EMA would open the door to a potential move towards the ~Rs125s, as indicated by the weekly chart.
OGDC
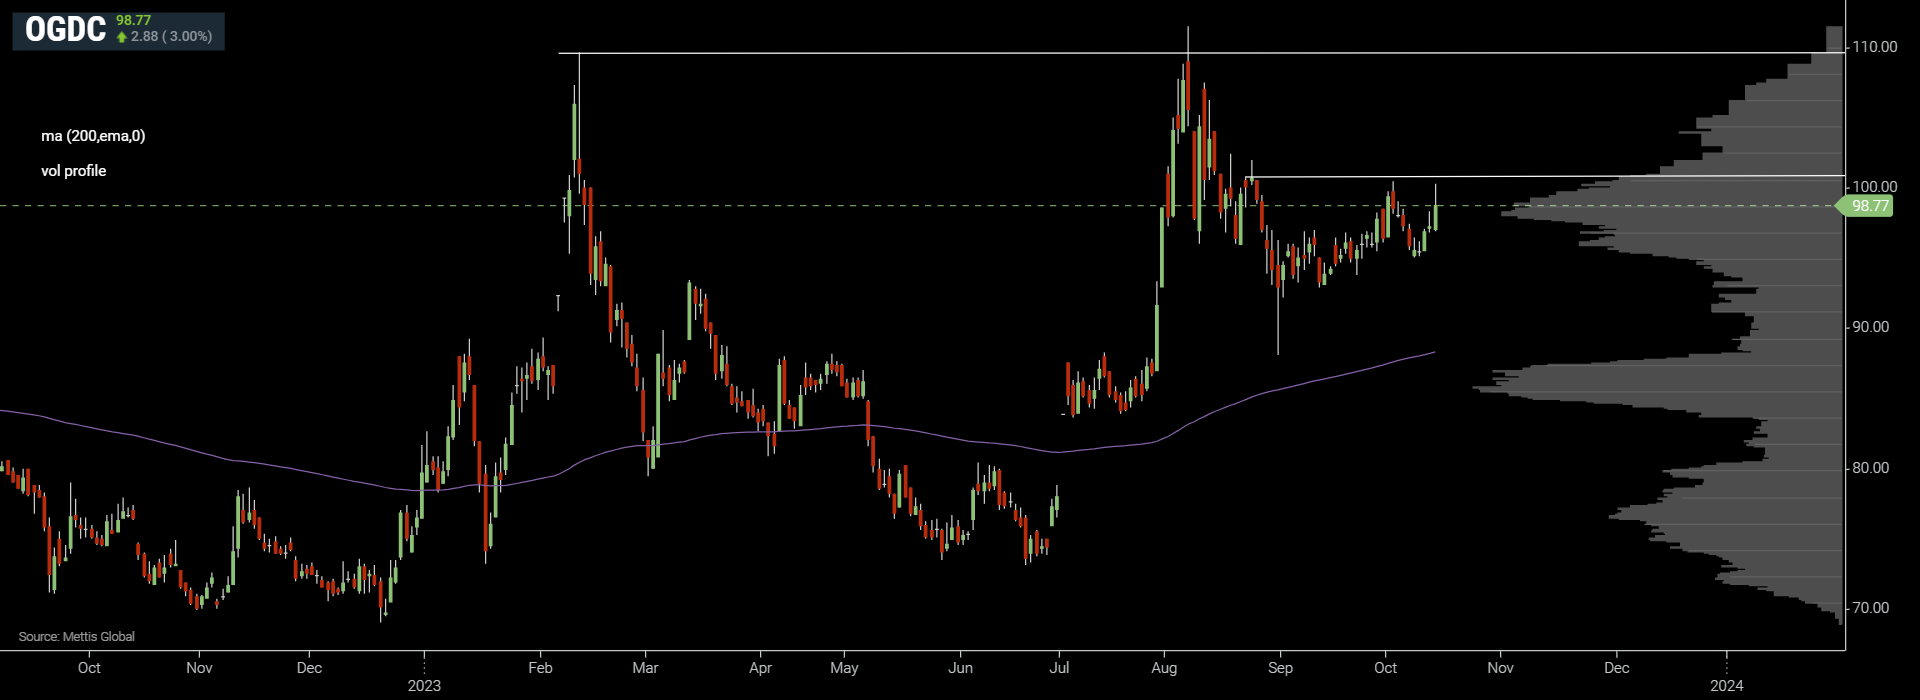
Despite the bullish market momentum, OGDC remained a laggard.
In order to make any upward progress, it needs to clear the Rs100-104 resistance zone. This breakthrough will pave the way for a retest of the Rs110 level, which it has twice failed to breach this year.
Further gains will depend on the successful breach of this zone.
TRG
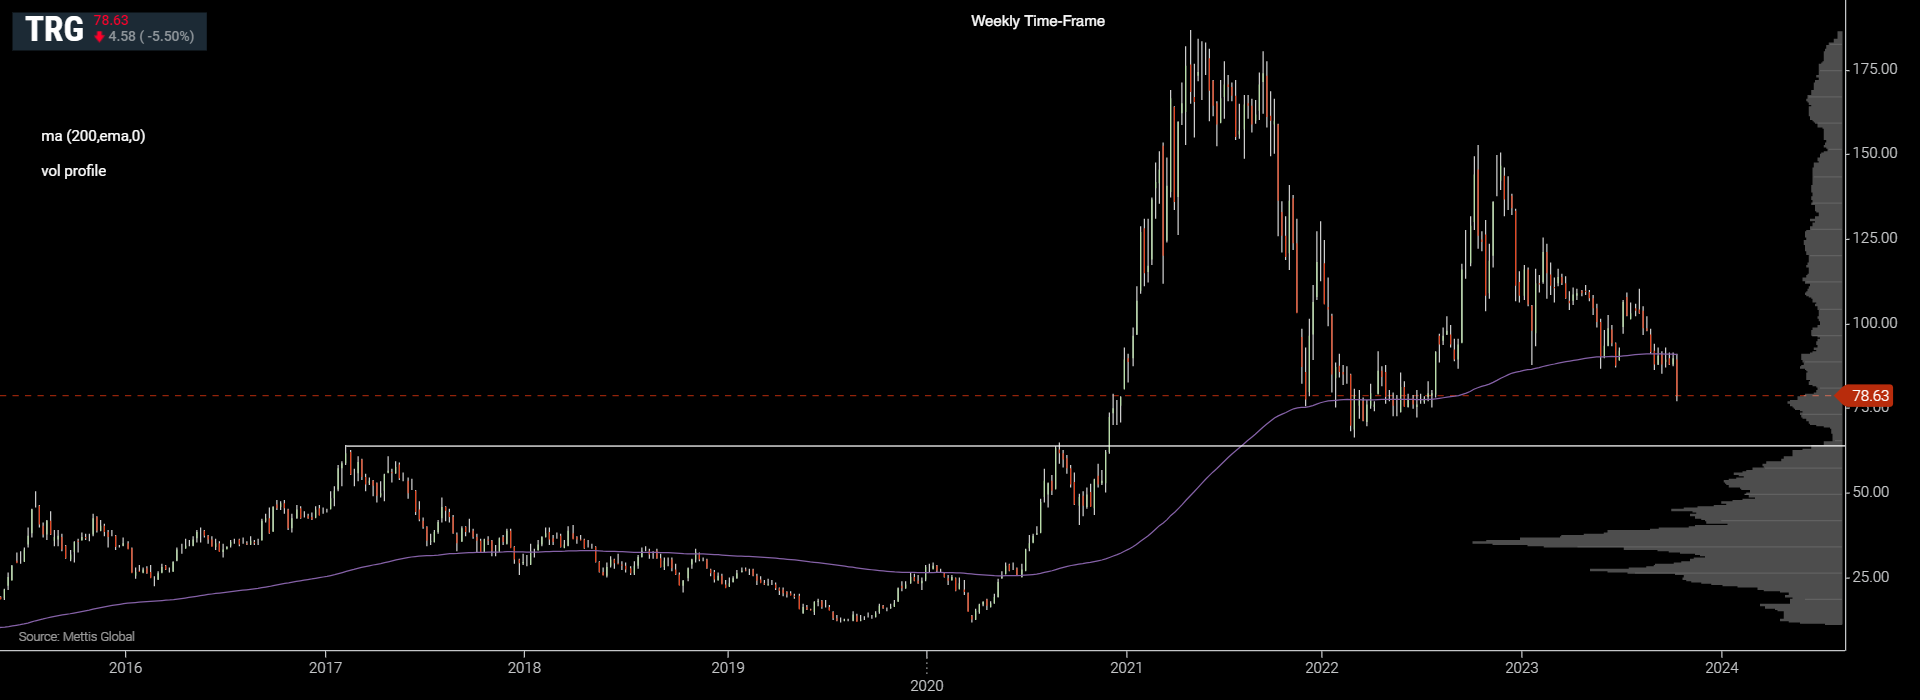
The past week was quite challenging for TRG, as it dropped by around 12.4% in just one week.
While a minor pullback can be expected from the current price level, it appears probable that it will decline towards the major support zone of Rs65-70.
Technical terms used:
Moving average (MA): A calculation that takes the arithmetic mean of a given set of prices over a specific number of days in the past.
Exponential moving average (EMA): A weighted average that gives greater importance to the price of a stock in more recent days, making it an indicator that is more responsive to new information.
High Volume Node (HVN): It refers to the price at which the largest amount of volume occurred.
Disclaimer: The views and analysis in this article are the opinions of the author and are for informational purposes only. It is not intended to be financial or investment advice and should not be the basis for making financial decisions.
Copyright Mettis Link News
Related News


| Name | Price/Vol | %Chg/NChg |
|---|---|---|
| KSE100 | 171,725.29 261.56M | 2.31% 3881.05 |
| ALLSHR | 103,214.49 498.64M | 2.00% 2024.02 |
| KSE30 | 51,517.14 135.33M | 2.40% 1209.13 |
| KMI30 | 246,565.71 111.44M | 2.29% 5524.54 |
| KMIALLSHR | 67,042.77 274.55M | 1.94% 1273.86 |
| BKTi | 47,299.71 43.26M | 3.04% 1394.54 |
| OGTi | 36,341.37 10.64M | 2.20% 783.44 |
| Symbol | Bid/Ask | High/Low |
|---|
| Name | Last | High/Low | Chg/%Chg |
|---|---|---|---|
| BITCOIN FUTURES | 77,610.00 | 77,935.00 76,105.00 | 1835.00 2.42% |
| BRENT CRUDE | 97.47 | 100.73 96.90 | -6.07 -5.86% |
| RICHARDS BAY COAL MONTHLY | 110.00 | 0.00 0.00 | -8.75 -7.37% |
| ROTTERDAM COAL MONTHLY | 113.00 | 0.00 0.00 | 0.30 0.27% |
| USD RBD PALM OLEIN | 1,157.50 | 1,157.50 1,157.50 | 0.00 0.00% |
| CRUDE OIL - WTI | 90.98 | 93.90 90.32 | -5.62 -5.82% |
| SUGAR #11 WORLD | 14.68 | 14.91 14.59 | -0.22 -1.48% |
Chart of the Day
Latest News
Top 5 things to watch in this week
Pakistan Stock Movers
| Name | Last | Chg/%Chg |
|---|
| Name | Last | Chg/%Chg |
|---|