SGF's profit spikes by 72% YoY to Rs787.46m in 9MCY23
.png?width=950&height=450&format=Webp)
MG News | October 24, 2023 at 04:02 PM GMT+05:00

October 24, 2023 (MLN): Service GlobalFootwear Limited (PSX: SGF) has revealed its profit and loss statement for the 9MCY23, as per which the company's profit rose by 72.04% YoY to Rs787.46m [EPS: 3.84], compared to the profit of Rs457.71m [EPS: 2.24] reported in the Same Period Last Year (SPLY).
Going by the results, the company's top line increased by 40.05% YoY to Rs11.95bn as compared to Rs8.53bn in SPLY.
Similarly, the cost of sales went up by 38.95% YoY but was lesser than proportionate to sales increase, which improved the gross profit by 44.06% YoY to Rs2.65bn in 9MCY23.
On the expense side, the company observed an increase in Distribution expenses by 34.05% YoY and administrative expenses by 25.34% YoY to clock in at Rs931.88m and Rs476.13m respectively during the review period.
Conversely, SGF's other expenses went significantly down to Rs60.89m in 9MCY23, compared to Rs154.53m in the SPLY, reflecting a decline of 60.59% YoY.
During the review period, other income surged by 22.39% YoY to stand at Rs581.77m in 9MCY23 as compared to Rs475.33m in SPLY.
The company’s finance costs soared by 3.11x YoY and stood at Rs796.74m as compared to Rs255.97m in 9MCY22, mainly due to higher interest rates.
On the tax front, the company paid a higher tax worth Rs385.53m against the Rs270.22m paid in the corresponding period of last year, depicting a rise of 42.67% YoY.
| Condensed Consolidated Interim Financial Results for Nine months ended September 2023 | |||
|---|---|---|---|
| Sep 23 | Sep 22 | % Change | |
| Sales | 11,947,771 | 8,531,184 | 40.05% |
| Cost of sales | (9,300,399) | (6,693,532) | 38.95% |
| Gross Profit | 2,647,372 | 1,837,652 | 44.06% |
| Distribution expenses | (931,882) | (695,200) | 34.05% |
| Administrative expenses | (479,126) | (382,247) | 25.34% |
| Share of profit/ loss of equity accounted investee | 212,488 | (97,112) | - |
| Other Income | 581,767 | 475,334 | 22.39% |
| Other expenses | (60,894) | (154,530) | -60.59% |
| Finance cost | (796,741) | (255,965) | 211.27% |
| Profit before tax | 1,172,984 | 727,932 | 61.14% |
| Taxation | (385,528) | (270,220) | 42.67% |
| Net profit for the period | 787,456 | 457,712 | 72.04% |
| Basic and diluted earnings/ (loss) per share | 3.84 | 2.24 | - |
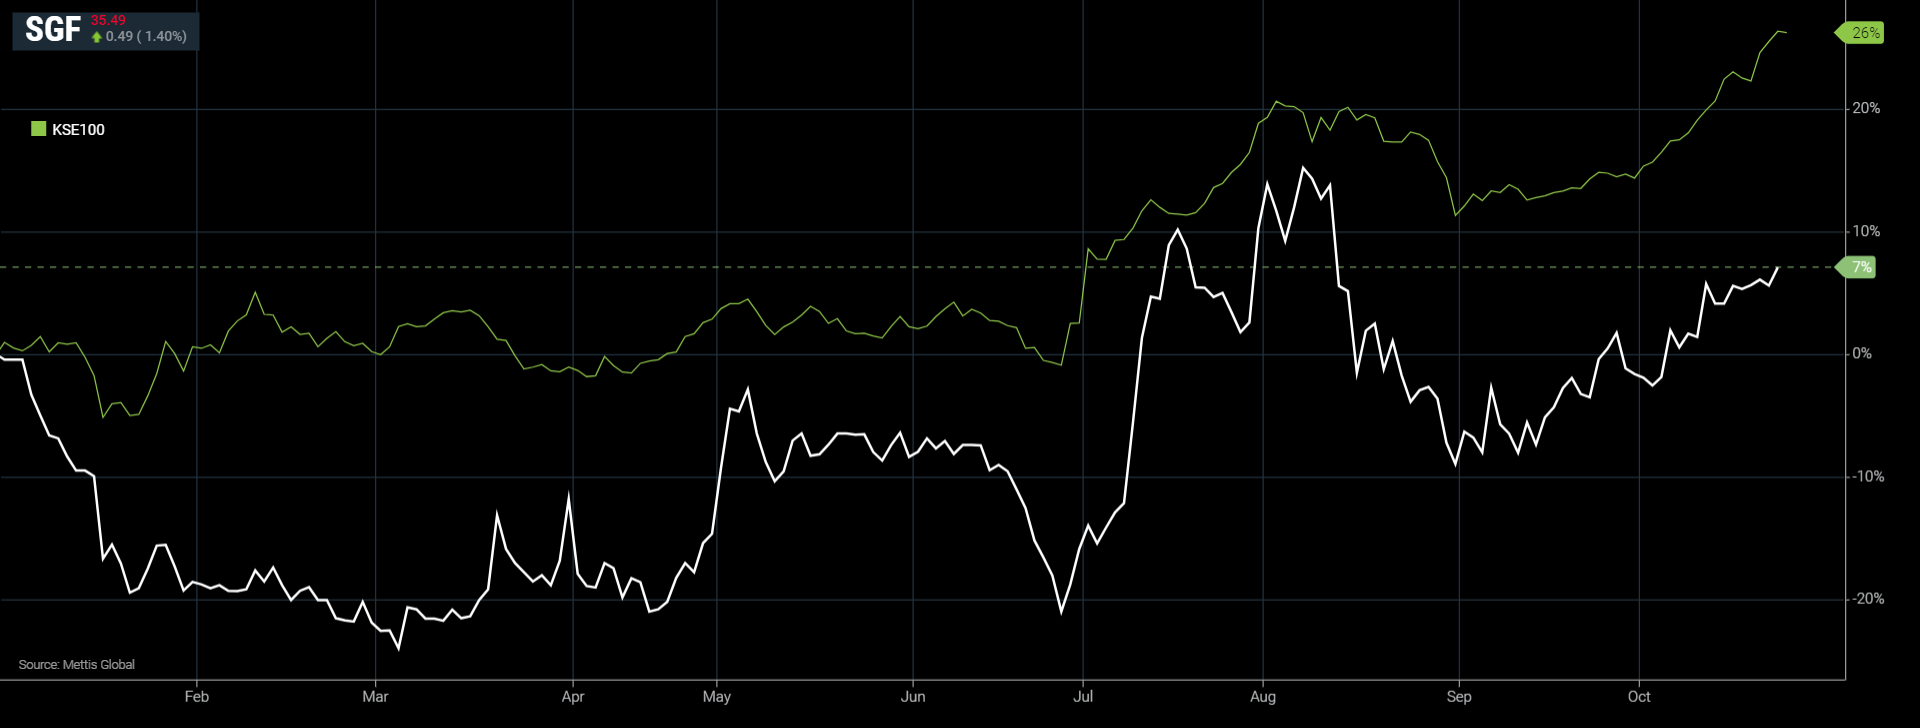
SGF and KSE-100 YTD Performance
Copyright Mettis Link News
Related News


| Name | Price/Vol | %Chg/NChg |
|---|---|---|
| KSE100 | 171,021.20 228.53M | -0.42% -718.25 |
| ALLSHR | 103,836.39 572.65M | -0.41% -422.85 |
| KSE30 | 50,951.99 89.47M | -0.52% -264.77 |
| KMI30 | 240,633.87 93.99M | -0.31% -756.80 |
| KMIALLSHR | 66,572.75 300.61M | -0.28% -185.59 |
| BKTi | 48,673.23 31.18M | -0.70% -343.86 |
| OGTi | 33,702.25 6.35M | -0.61% -205.57 |
| Symbol | Bid/Ask | High/Low |
|---|
| Name | Last | High/Low | Chg/%Chg |
|---|---|---|---|
| BITCOIN FUTURES | 64,715.00 | 64,825.00 63,875.00 | 500.00 0.78% |
| BRENT CRUDE | 98.70 | 101.19 95.13 | -1.99 -1.98% |
| RICHARDS BAY COAL MONTHLY | 105.75 | 0.00 0.00 | -1.55 -1.44% |
| ROTTERDAM COAL MONTHLY | 121.10 | 121.10 121.10 | 0.70 0.58% |
| USD RBD PALM OLEIN | 1,175.00 | 1,175.00 1,175.00 | 0.00 0.00% |
| CRUDE OIL - WTI | 90.47 | 0.00 0.00 | 1.16 1.30% |
| SUGAR #11 WORLD | 14.76 | 14.79 14.54 | 0.07 0.48% |
Chart of the Day
Latest News
Top 5 things to watch in this week
Pakistan Stock Movers
| Name | Last | Chg/%Chg |
|---|
| Name | Last | Chg/%Chg |
|---|