SAZEW declares Rs12 dividend as profit spikes 700% in FY24

MG News | September 23, 2024 at 03:31 PM GMT+05:00
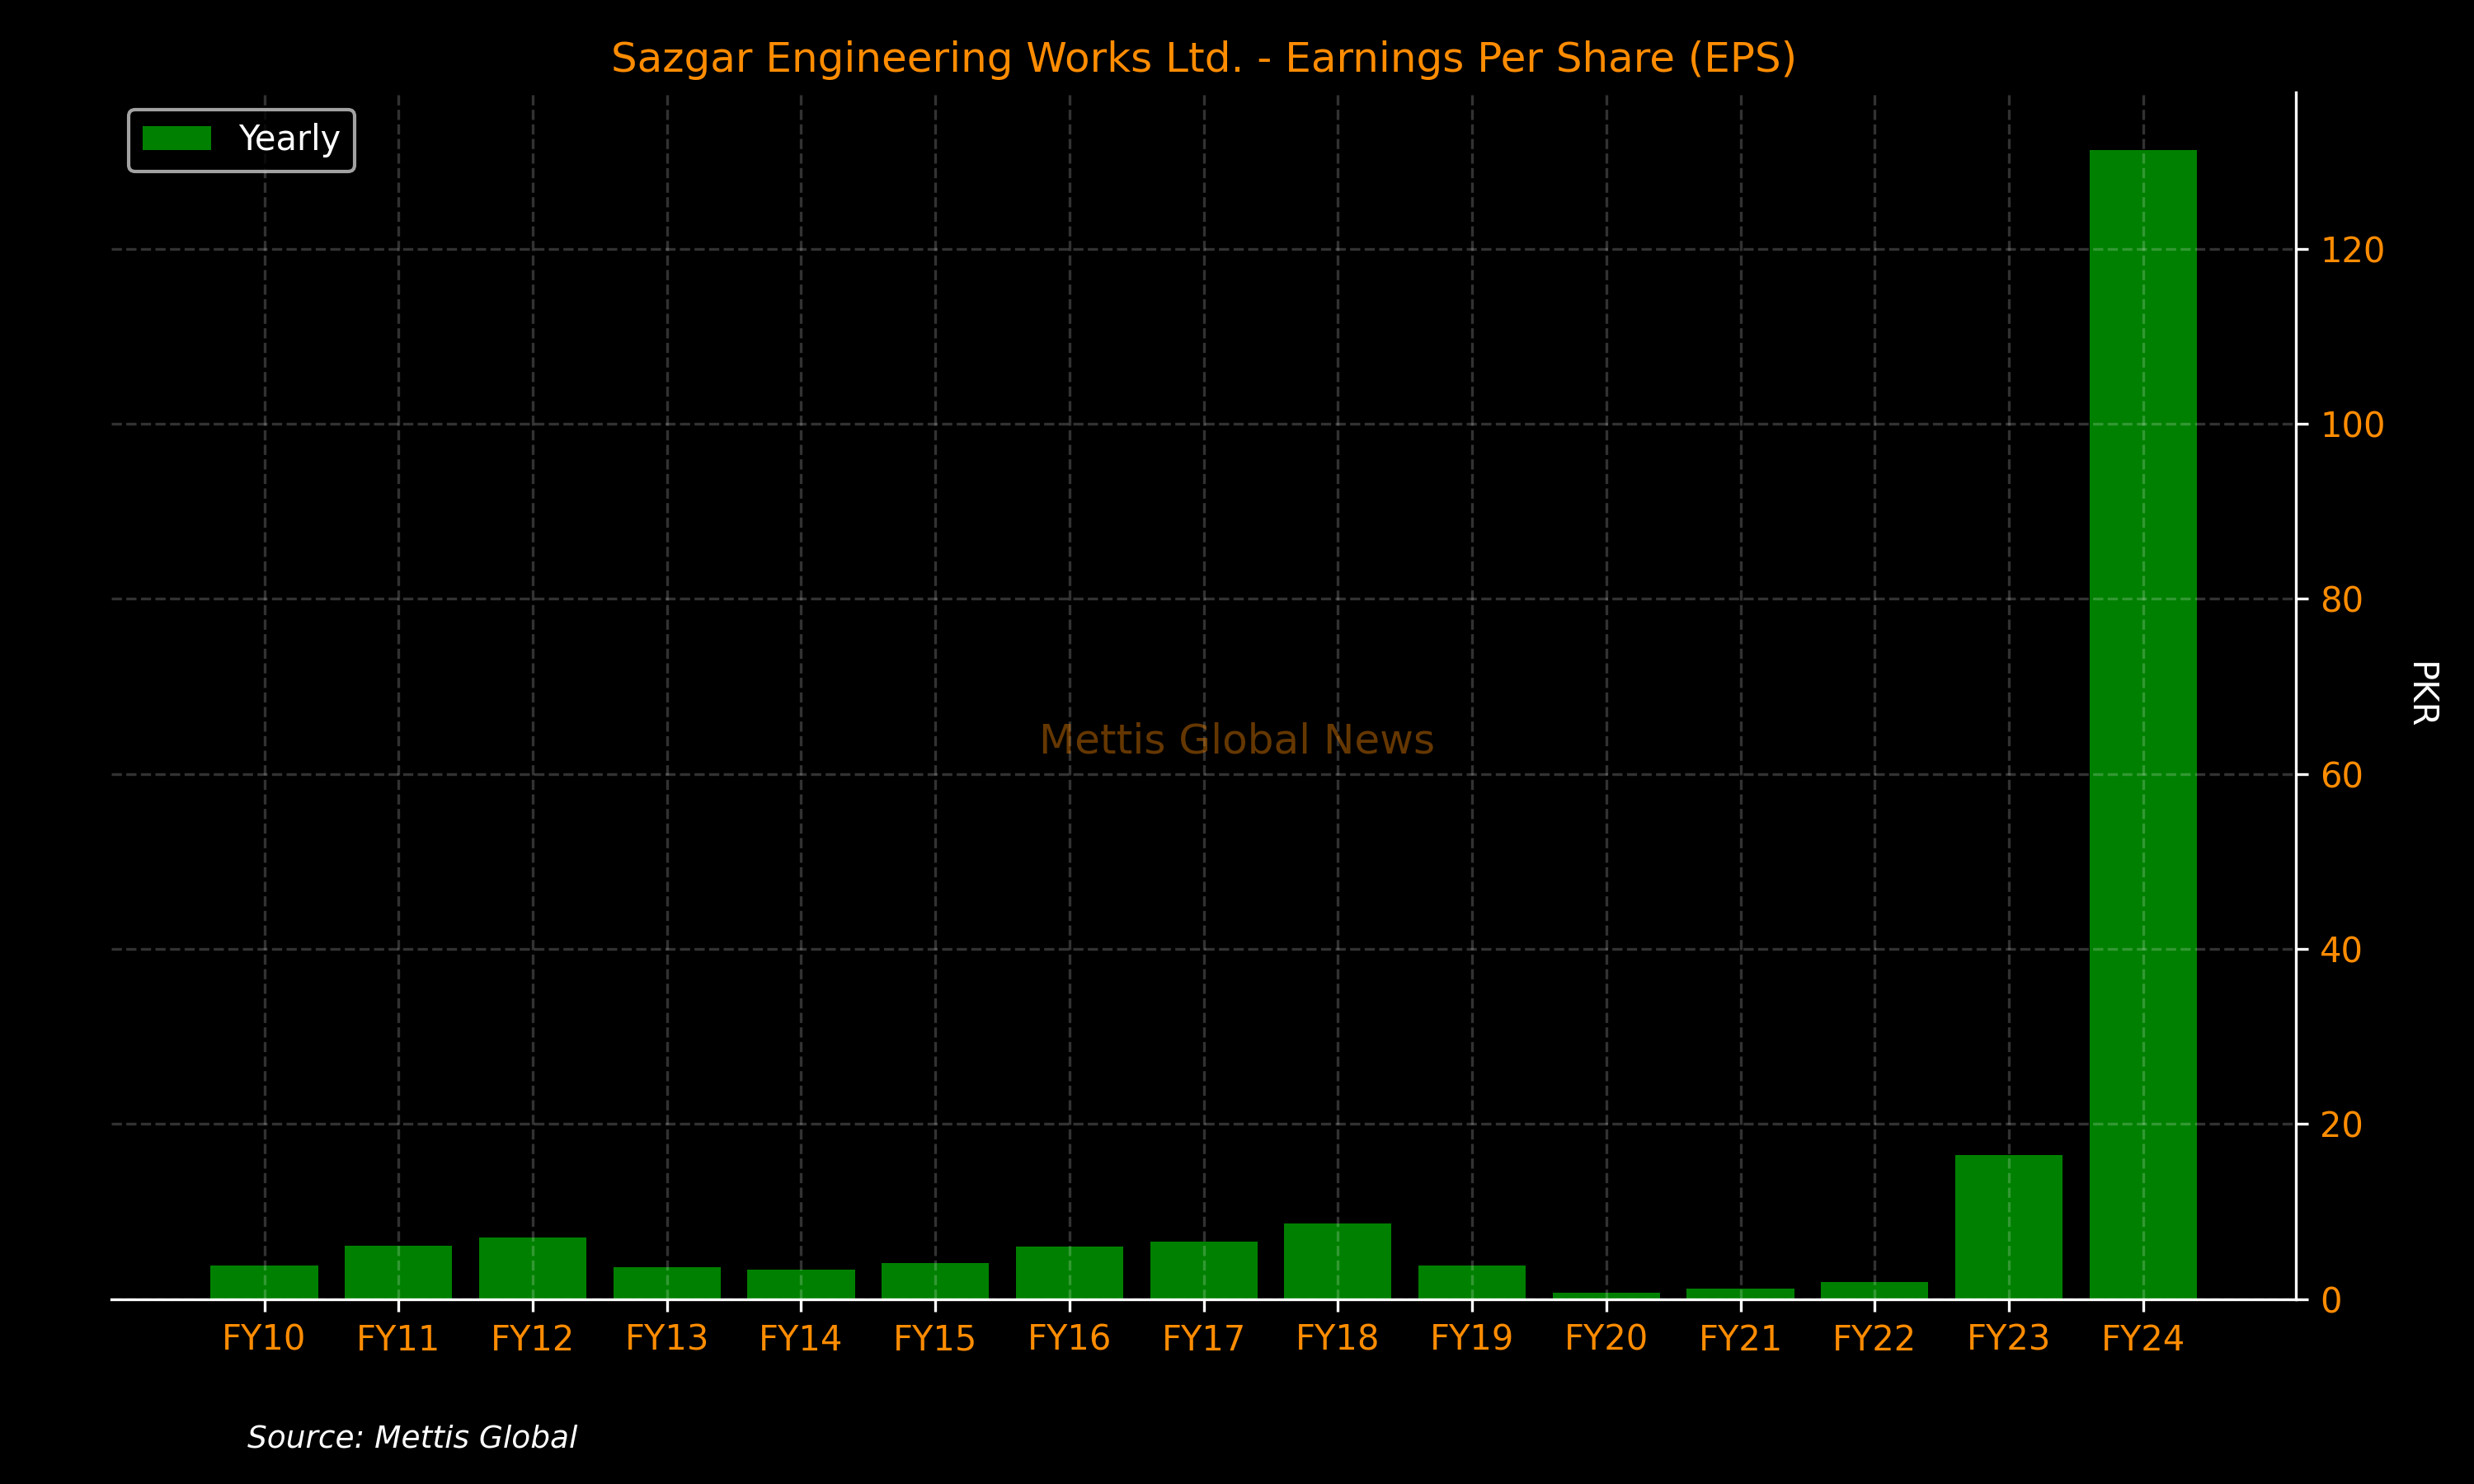
September 23, 2024 (MLN): Sazgar Engineering Works Limited (PSX: SAZEW) reported a remarkable profit of Rs7.94 billion for the year ended June 30, 2024 (FY24), which is an impressive nearly 700% increase compared to the earnings of Rs995.08 million in FY23.
The Earnings per Share (EPS) of the company arrived at Rs131.29, compared to Rs16.46 in the previous financial year.
Along with the results, the company announced a final cash dividend of Rs12 per ordinary share subject to the approval of shareholders in the forthcoming 33rd Annual General Meeting of the Company. This is in addition to the interim cash dividend already paid at Rs8 per share.
Read more: SAZEW: A Tech-Savvy Titan
According to the profit and loss account, the company's top line surged 217.2% to Rs57.64bn as compared to Rs18.17bn in FY23.
The cost of sales rose by 168.8% but the rise in sales outpaced costs, which improved the gross profit by 513.7% to Rs15.65bn in FY24.
Subsequently, the gross margins improved to 27.1% as compared to 14.0% in SPLY.
The low car sales in the previous fiscal year can be attributed to the overall challenges faced by the auto sector, including higher interest rates, import restrictions, and sluggish demand.
SAZEW reported a substantial rise in expenses due to expanded operations.
Administrative expenses increased by 59.9% YoY to Rs383.3 million, while distribution costs surged by 207.7% YoY to Rs1.81bn. Additionally, other operating expenses were reported at Rs999.81m, reflecting a dramatic increase of 876.4% YoY.
Further boosting its earnings, other income surged by an astonishing 2,588.3%, reaching Rs832.39 million in FY24 compared to Rs30.96 million in the same period last year.
The company’s finance cost stood at Rs168.91m as compared to Rs168.36m in SPLY, largely unchanged.
On the tax front, the company paid a higher tax worth Rs5.18bn against the Rs486.36m paid in the corresponding period of last year, depicting a rise of 965.1%.
| Unconsolidated (un-audited) Financial Results for year ended June 30, 2024 (Rupees in '000) | |||
|---|---|---|---|
| Jun 24 | Jun 23 | % Change | |
| Sales | 57,642,469 | 18,174,297 | 217.16% |
| Cost of sales | (41,996,099) | (15,624,821) | 168.78% |
| Gross Profit/ (loss) | 15,646,370 | 2,549,476 | 513.71% |
| Administrative Expenses | (383,303) | (239,758) | 59.87% |
| Distribution cost | (1,810,896) | (588,484) | 207.72% |
| Other Income | 832,388 | 30,964 | 2588.25% |
| Other Operating Expenses | (999,809) | (102,401) | 876.36% |
| Finance Cost | (168,911) | (168,361) | 0.33% |
| Profit/ (loss) before taxation | 13,115,840 | 1,481,436 | 785.35% |
| Final tax / levies | (5,180,163) | (486,359) | 965.09% |
| Net profit/ (loss) for the period | 7,935,677 | 995,077 | 697.49% |
| Basic earnings/ (loss) per share | 131.29 | 16.46 | - |
Amount in thousand except for EPS
Copyright Mettis Link News
Related News


| Name | Price/Vol | %Chg/NChg |
|---|---|---|
| KSE100 | 150,398.71 270.15M | -1.06% -1612.55 |
| ALLSHR | 90,084.08 469.39M | -0.93% -849.88 |
| KSE30 | 45,453.36 99.47M | -1.14% -522.50 |
| KMI30 | 218,271.12 195.05M | -0.92% -2019.44 |
| KMIALLSHR | 58,965.48 294.49M | -0.81% -483.69 |
| BKTi | 41,775.34 33.94M | -0.76% -317.96 |
| OGTi | 31,328.42 11.96M | -0.61% -192.61 |
| Symbol | Bid/Ask | High/Low |
|---|
| Name | Last | High/Low | Chg/%Chg |
|---|---|---|---|
| BITCOIN FUTURES | 67,165.00 | 67,625.00 66,480.00 | -15.00 -0.02% |
| BRENT CRUDE | 109.24 | 109.74 99.08 | 8.08 7.99% |
| RICHARDS BAY COAL MONTHLY | 112.50 | 0.00 0.00 | 6.40 6.03% |
| ROTTERDAM COAL MONTHLY | 113.00 | 114.50 113.00 | -0.40 -0.35% |
| USD RBD PALM OLEIN | 1,175.00 | 1,175.00 1,175.00 | 0.00 0.00% |
| CRUDE OIL - WTI | 112.06 | 113.97 97.50 | 11.94 11.93% |
| SUGAR #11 WORLD | 14.96 | 15.50 14.91 | -0.33 -2.16% |
Chart of the Day
Latest News
Top 5 things to watch in this week
Pakistan Stock Movers
| Name | Last | Chg/%Chg |
|---|
| Name | Last | Chg/%Chg |
|---|