PKR flashes signal of spike in volatility
Abdur Rahman | May 16, 2024 at 08:07 PM GMT+05:00
May 16, 2024 (MLN): The Pakistani Rupee (PKR) may break out of an unusually low period of volatility, chart patterns and the currency’s historical trends suggest.
10-day and 30-day annualized volatility for the USDPKR, gauges of how much the currency pair swings, has remained dead flat this year.
Average 30-day annualized volatility stands at just 0.67 in 2024. That compares with an average of 12.87 last year, and 8.47 in 2022.
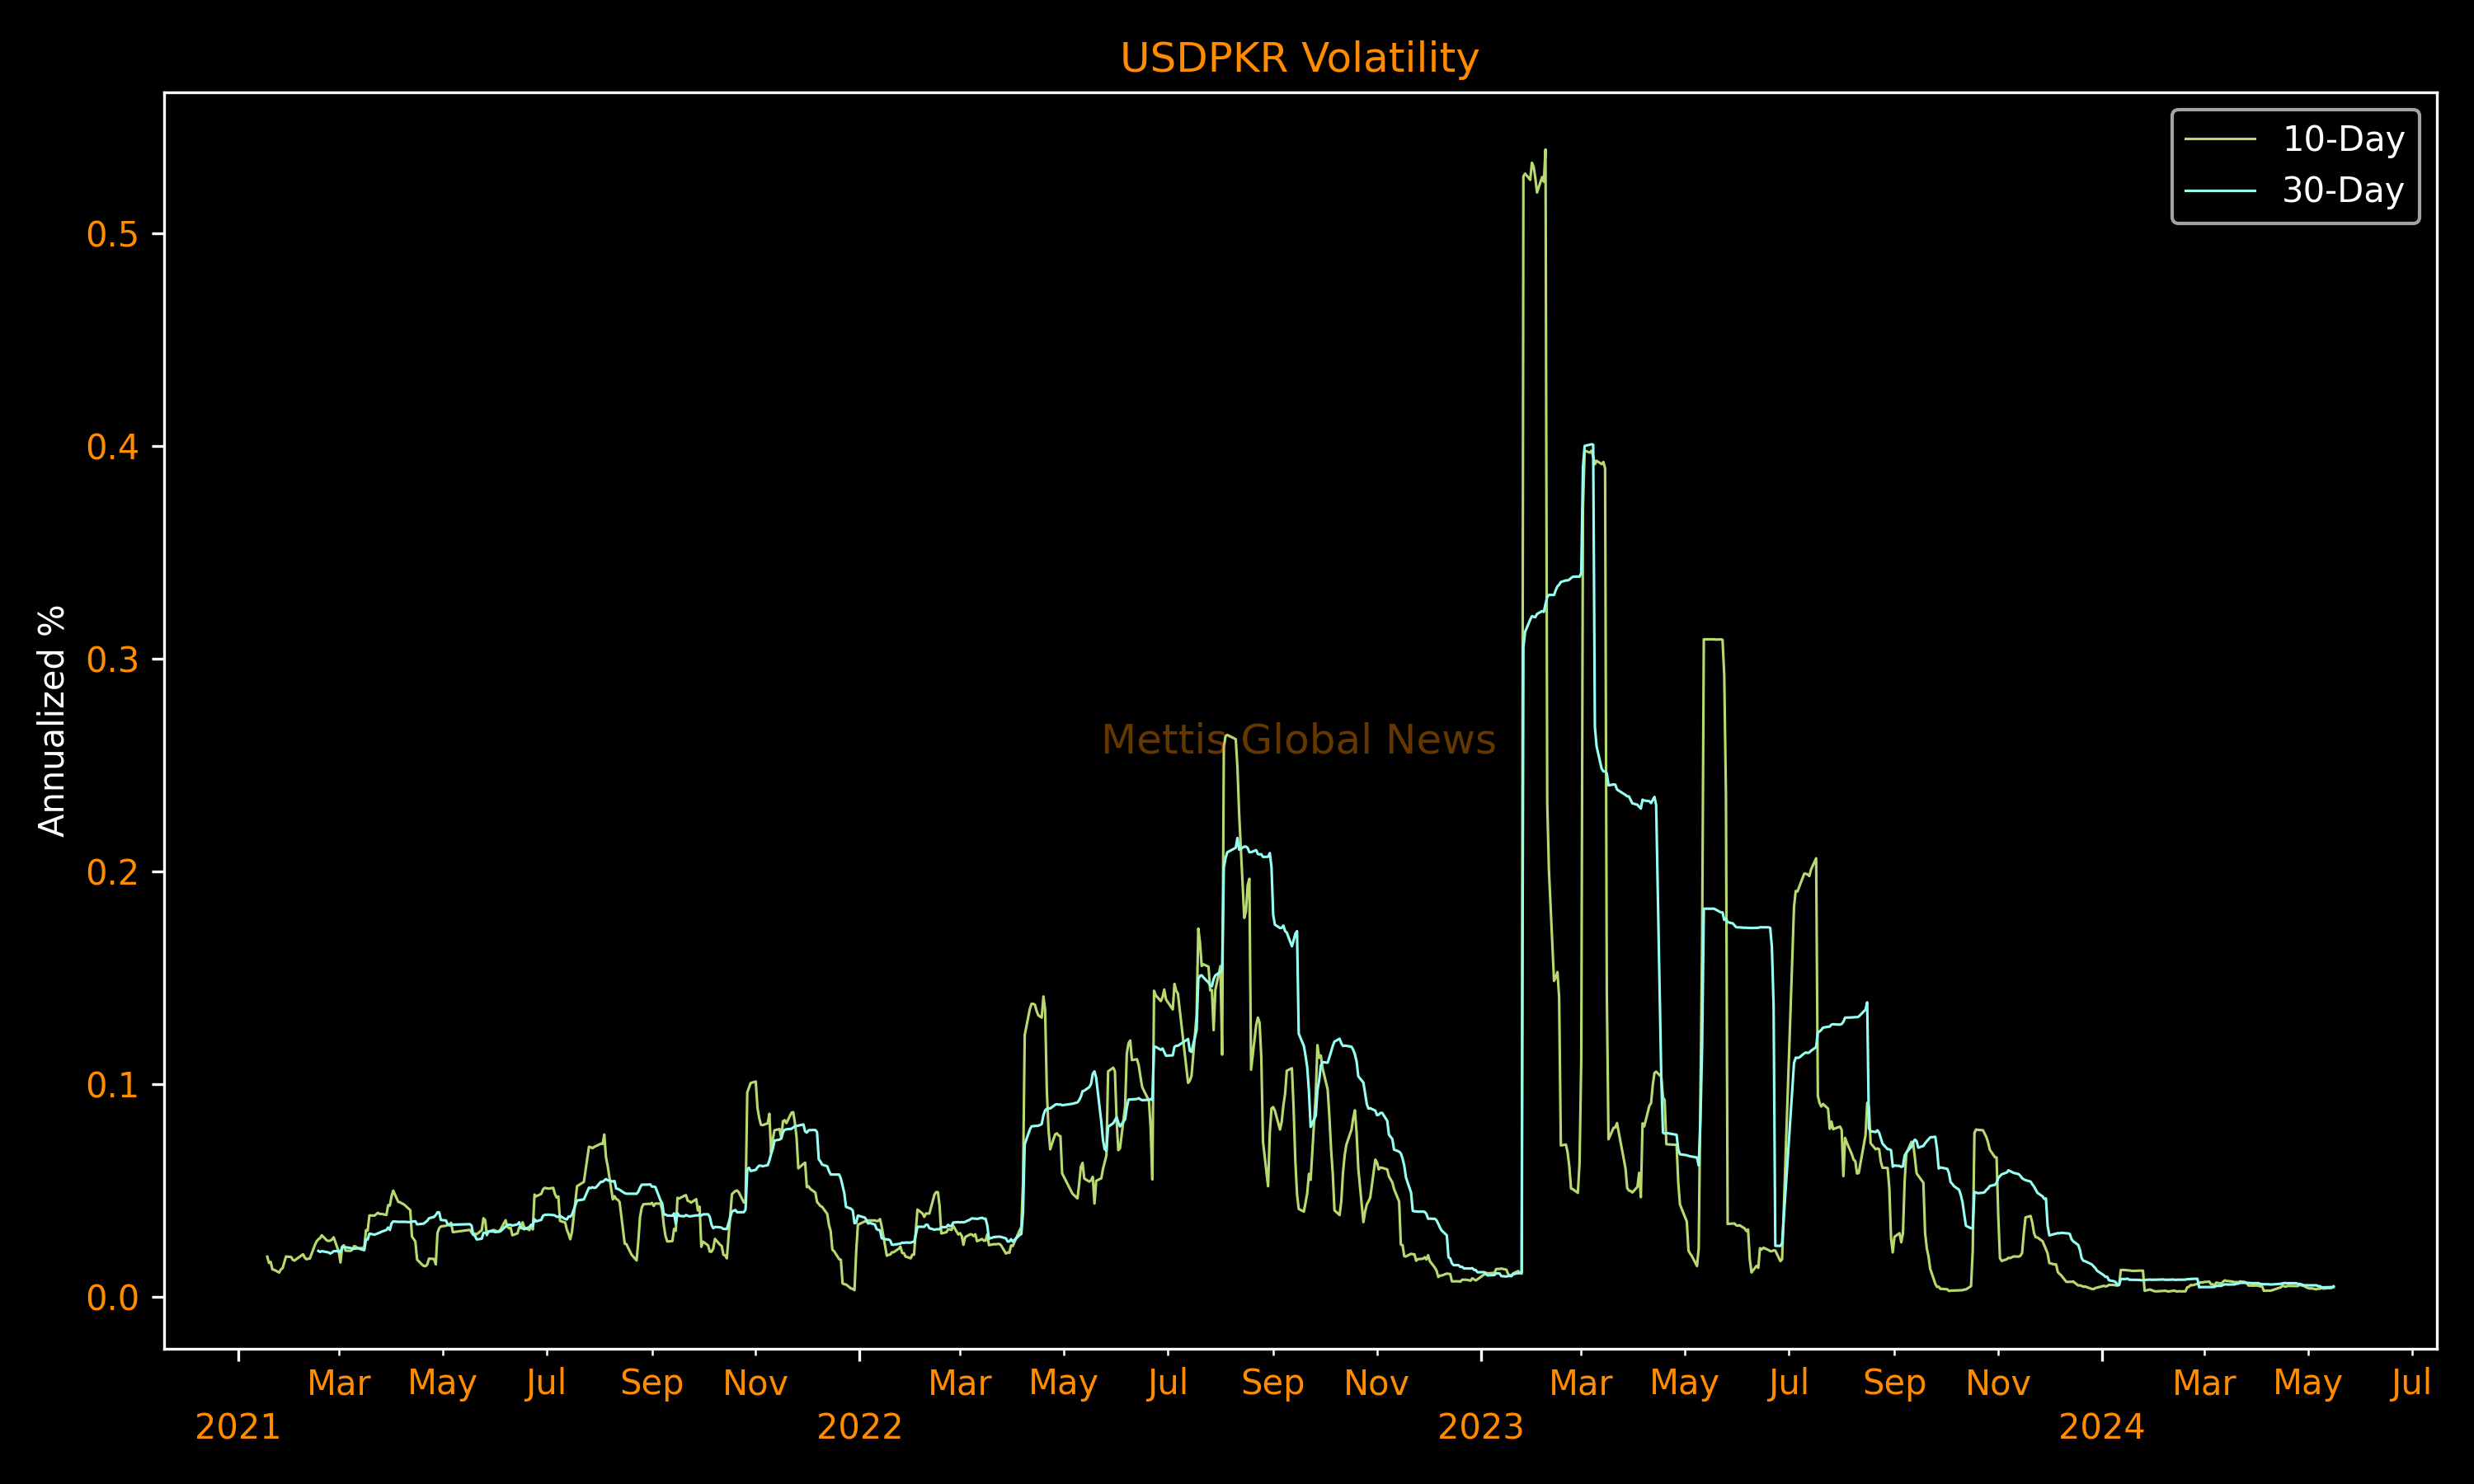
The dull volatility coincides with a cooling in the pair's depreciation compared to historical average.
The fiscal year-to-date gain stands at 2.7%, compared to the significant 14.7% 5-year average depreciation.
Read: PKR stands rock-solid against mighty Dollar in 2024
Momentum builds up
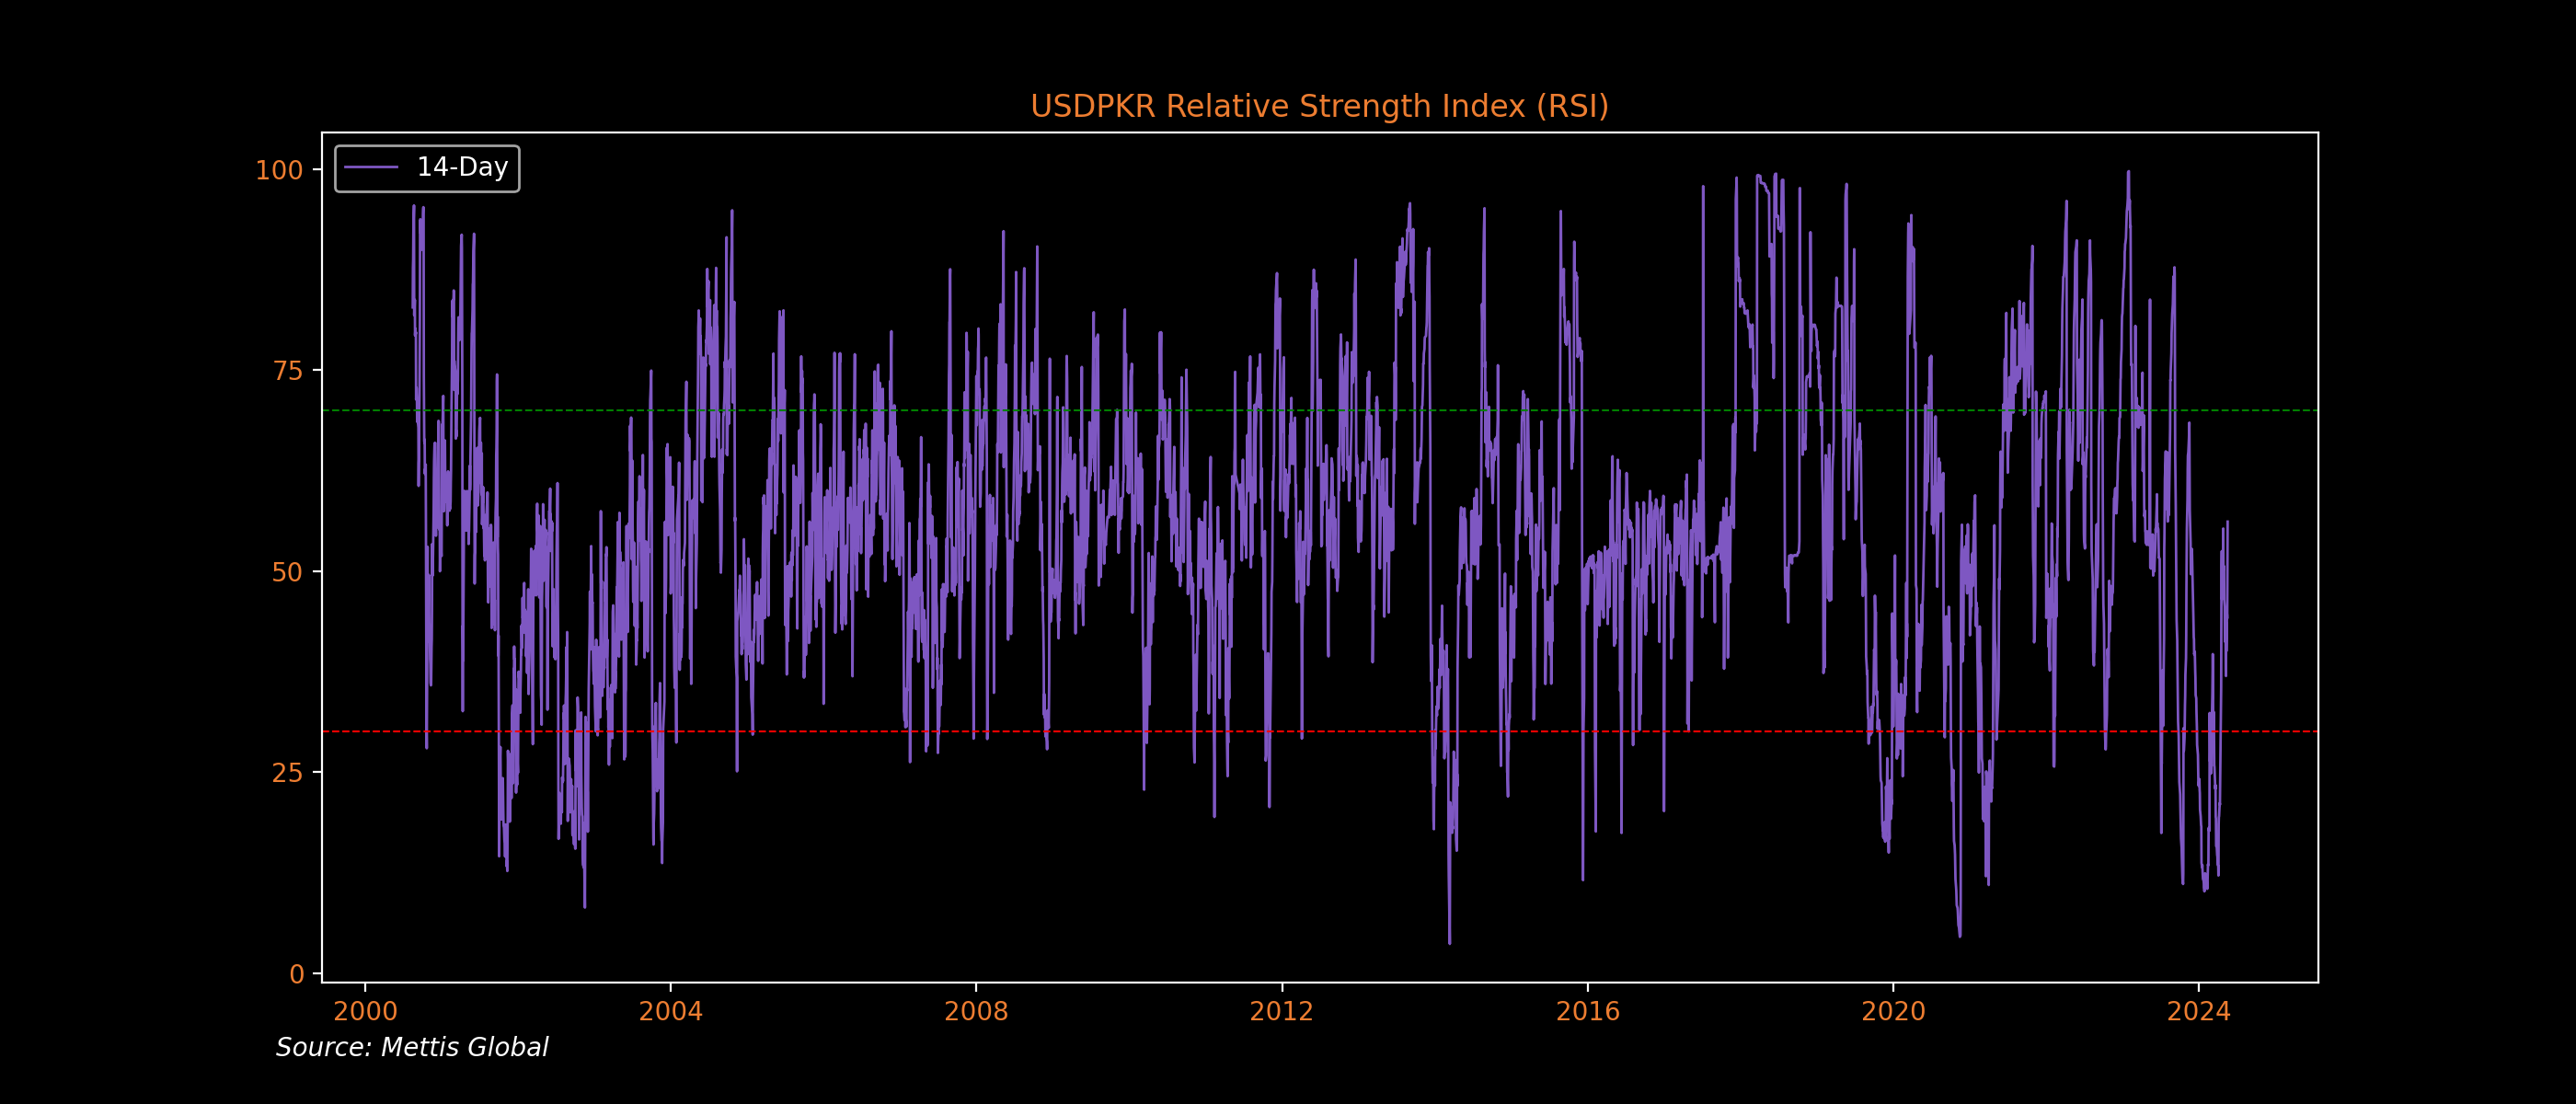
Investors who put store in technical analysis tracks relative strength index (RSI) as a measure of momentum.
RSI for USDPKR, a 0-100 gauge meter, fell to as low as 10 earlier in February, well below the level of 30 typically seen as oversold.
It has now rebounded to 56, signaling a possible gain of momentum.
There have been just 3 instances since the year 2000 when the RSI dropped below 10.
In these cases, once the RSI rebounded back above 60—a sign of increasing momentum—the PKR lost an average 3.7% against USD over the next three months.
Read: USD/PKR reaches oversold territory
During a downtrend, the RSI tends to stay between the 10 to 60 range with the 50-60 zone acting as resistance.
A break of 60 signifies a break of resistance.
It is worth noting that RSI on its own does not necessarily mean anything. It is just one indicator among many that can help investors gauge the market.
Disclaimer: The views and analysis in this article are the opinions of the author and are for informational purposes only. It is not intended to be financial or investment advice and should not be the basis for making financial decisions.
Copyright Mettis Link News
Related News


| Name | Price/Vol | %Chg/NChg |
|---|---|---|
| KSE100 | 153,866.17 113.04M | -0.36% -555.27 |
| ALLSHR | 92,322.41 289.91M | -0.18% -165.37 |
| KSE30 | 47,054.02 67.50M | -0.57% -268.71 |
| KMI30 | 220,139.18 52.42M | -0.81% -1787.82 |
| KMIALLSHR | 59,630.44 114.87M | -0.43% -258.98 |
| BKTi | 44,089.65 23.49M | -0.09% -38.05 |
| OGTi | 31,668.31 6.28M | -0.15% -47.11 |
| Symbol | Bid/Ask | High/Low |
|---|
| Name | Last | High/Low | Chg/%Chg |
|---|---|---|---|
| BITCOIN FUTURES | 71,495.00 | 74,210.00 70,200.00 | 850.00 1.20% |
| BRENT CRUDE | 103.89 | 103.95 97.60 | 3.43 3.41% |
| RICHARDS BAY COAL MONTHLY | 99.40 | 0.00 0.00 | -12.90 -11.49% |
| ROTTERDAM COAL MONTHLY | 122.70 | 123.80 122.70 | -1.10 -0.89% |
| USD RBD PALM OLEIN | 1,083.50 | 1,083.50 1,083.50 | 0.00 0.00% |
| CRUDE OIL - WTI | 99.31 | 99.32 92.04 | 3.58 3.74% |
| SUGAR #11 WORLD | 14.41 | 14.53 14.30 | 0.03 0.21% |
Chart of the Day
Latest News
Top 5 things to watch in this week
Pakistan Stock Movers
| Name | Last | Chg/%Chg |
|---|
| Name | Last | Chg/%Chg |
|---|