PKR falls by around 4 paisa against USD

MG News | June 03, 2024 at 04:06 PM GMT+05:00

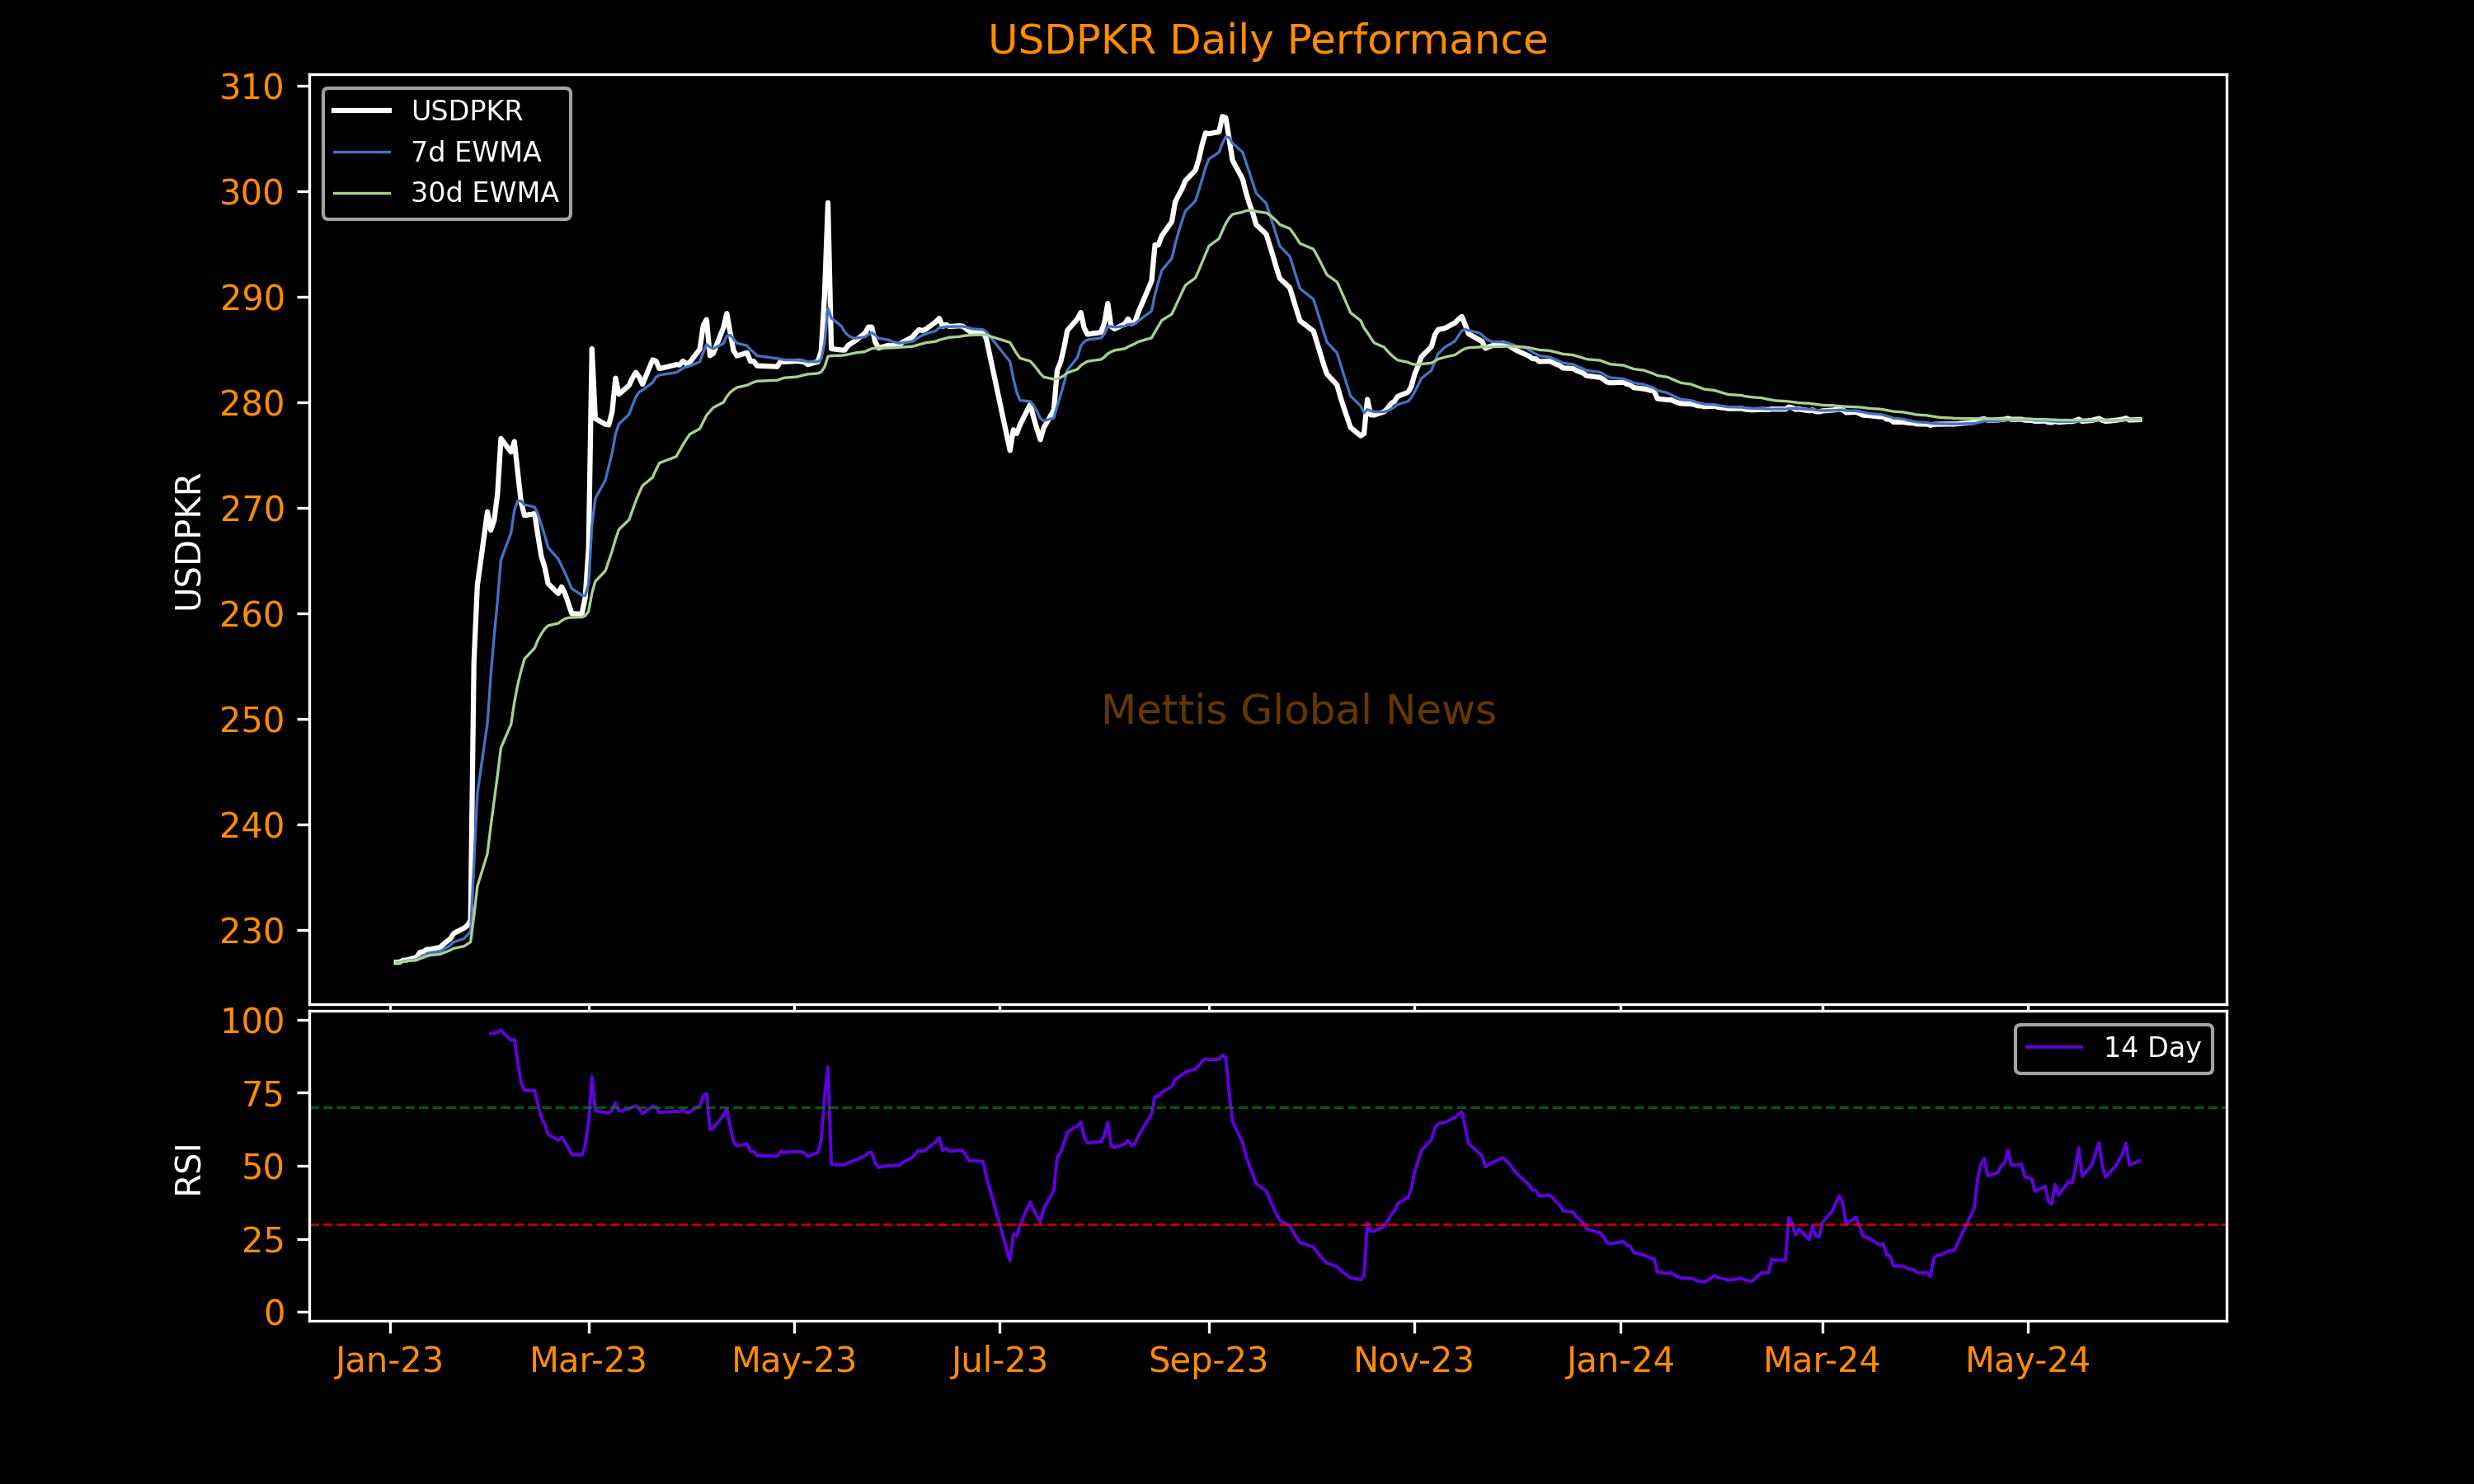
June 03, 2024 (MLN): The Pakistani rupee (PKR) depreciated by 3.73 paisa against the US dollar in Monday's interbank session as the currency settled the trade at PKR 278.36 per USD, compared to the previous session's closing of PKR 278.33 per USD.
The currency saw an intraday high (bid) of 278.6 and a low (ask) of 278.4.
In the open market, exchange companies quoted the dollar at 277.18 for buying and 279.54 for selling.
Pakistan's currency, though not registering any gains, has successfully managed to maintain stability against the mighty Dollar for another month in light of stable economic operations.
The Rupee settled May at 278.33 per USD, reflecting a meager 1 paisa drop compared to the previous month's closing rate of 278.31 per USD.
The successful conclusion of the 9-month SBA with the International Monetary Fund (IMF) proved to be the primary catalyst for the persistent strengthening journey of the Pak Rupee as it provided a policy anchor to eliminate FX shortages by returning to proper FX market functioning.
In comparison to major currencies, PKR lost 44.4 paisa against the Euro, closing at 301.68 compared to the previous value of 301.23.
The British Pound became expensive by 22.83 paisa closing at 353.86 compared to 353.63 from a day ago.
The Swiss franc saw gains of 85.93 paisa, closing at 308.44 compared to 307.58 from the previous session.
Against the Japanese Yen, PKR lost 0.06 paisa, closing at 1.7717 versus 1.7711 a day ago.
The Chinese Yuan lost 1.73 paisa, closing at 38.41 against 38.43 from the previous session.
The Saudi Riyal closed at 74.21 with a gain of 0.8 paisa from its value of 74.21 a day ago.
The U.A.E Dirham increased in value by 0.91 paisa from 75.78 a day ago to 75.78.
During the current financial year, PKR has appreciated against the Dollar by 7.63 rupees or 2.74%. While the current calendar year has seen PKR appreciate by 3.5 rupees or 1.26%.
In the Money Market, the benchmark 6 Month Karachi Interbank Bid and Offer rates inched down by 11 bps to 20.66% and 20.91%.
Performance Summary
| Currency | Jun 03, 2024 | May 31, 2024 | Change | 1 Month | FYTD | CYTD | 1 Day | 7 Day | 1 Month | MTD | FYTD | CYTD |
|---|---|---|---|---|---|---|---|---|---|---|---|---|
| USD | 278.3636 | 278.3263 | -0.0373 | -0.1539 | 7.6269 | 3.4971 | -0.01% | -0.02% | -0.06% | -0.01% | 2.74% | 1.26% |
| EUR | 301.6766 | 301.2326 | -0.444 | -2.8237 | 11.2542 | 9.8217 | -0.15% | 0.06% | -0.94% | -0.15% | 3.73% | 3.26% |
| GBP | 353.8558 | 353.6275 | -0.2283 | -4.5218 | 10.2815 | 4.7414 | -0.06% | 0.15% | -1.28% | -0.06% | 2.91% | 1.34% |
| CHF | 308.4362 | 307.5769 | -0.8593 | -1.9028 | 11.3206 | 26.6336 | -0.28% | -1.42% | -0.62% | -0.28% | 3.67% | 8.64% |
| JPY | 1.7717 | 1.7711 | -0.0006 | 0.0433 | 0.2206 | 0.2178 | -0.03% | 0.11% | 2.44% | -0.03% | 12.45% | 12.29% |
| SAR | 74.2145 | 74.2065 | -0.008 | -0.0371 | 2.0395 | 0.9483 | -0.01% | -0.01% | -0.05% | -0.01% | 2.75% | 1.28% |
| AED | 75.7844 | 75.7753 | -0.0091 | -0.0378 | 2.0774 | 0.9583 | -0.01% | -0.02% | -0.05% | -0.01% | 2.74% | 1.26% |
| CNY | 38.4149 | 38.4322 | 0.0173 | 0.006 | 1.2548 | 1.2165 | 0.05% | 0% | 0.02% | 0.05% | 3.27% | 3.17% |
52 Week Performance
| Currency | High | Low | Trading Band | % Since High | % Since Low | High Date | Low Date | Days Since High | Days Since Low |
|---|---|---|---|---|---|---|---|---|---|
| USD | 275.438 | 307.1 | 31.6619 | -1.05% | 10.32% | 04-Jul-23 | 05-Sep-23 | 335 | 272 |
| EUR | 291.618 | 332.701 | 41.083 | -3.33% | 10.28% | 16-Oct-23 | 31-Aug-23 | 231 | 277 |
| GBP | 337.032 | 387.972 | 50.9401 | -4.75% | 9.64% | 16-Oct-23 | 31-Aug-23 | 231 | 277 |
| CHF | 306.458 | 347.163 | 40.7049 | -0.64% | 12.56% | 13-Oct-23 | 31-Aug-23 | 234 | 277 |
| JPY | 1.851 | 2.1004 | 0.2494 | 4.48% | 18.55% | 16-Oct-23 | 01-Sep-23 | 231 | 276 |
| SAR | 73.4412 | 81.8703 | 8.4291 | -1.04% | 10.32% | 04-Jul-23 | 05-Sep-23 | 335 | 272 |
| AED | 74.9888 | 83.6089 | 8.6201 | -1.05% | 10.32% | 04-Jul-23 | 05-Sep-23 | 335 | 272 |
| CNY | 37.8634 | 42.0637 | 4.2003 | -1.44% | 9.5% | 16-Oct-23 | 01-Sep-23 | 231 | 276 |
Copyright Mettis Link News
Related News
.jpg_20260424071638623_13fb19.jpeg?width=280&height=140&format=Webp)

.jpg_20260429074410761_cd3be6.jpeg?width=280&height=140&format=Webp)
| Name | Price/Vol | %Chg/NChg |
|---|---|---|
| KSE100 | 178,032.88 311.00M | -0.13% -229.45 |
| ALLSHR | 107,734.34 590.22M | -0.10% -103.10 |
| KSE30 | 53,260.41 73.49M | -0.16% -87.26 |
| KMI30 | 251,643.00 100.08M | 0.05% 132.63 |
| KMIALLSHR | 69,163.72 400.93M | -0.01% -10.14 |
| BKTi | 50,815.80 12.00M | -0.49% -248.92 |
| OGTi | 35,270.65 4.08M | 0.06% 22.23 |
| Symbol | Bid/Ask | High/Low |
|---|
| Name | Last | High/Low | Chg/%Chg |
|---|---|---|---|
| BITCOIN FUTURES | 63,575.00 | 64,810.00 63,035.00 | -1390.00 -2.14% |
| BRENT CRUDE | 86.33 | 88.06 86.22 | -2.03 -2.30% |
| RICHARDS BAY COAL MONTHLY | 105.75 | 0.00 0.00 | -1.55 -1.44% |
| ROTTERDAM COAL MONTHLY | 120.00 | 0.00 0.00 | 0.25 0.21% |
| USD RBD PALM OLEIN | 1,175.00 | 1,175.00 1,175.00 | 0.00 0.00% |
| CRUDE OIL - WTI | 80.98 | 82.43 80.60 | -1.63 -1.97% |
| SUGAR #11 WORLD | 14.56 | 14.75 14.54 | -0.21 -1.42% |
Chart of the Day
Latest News
Top 5 things to watch in this week
Pakistan Stock Movers
| Name | Last | Chg/%Chg |
|---|
| Name | Last | Chg/%Chg |
|---|