Pioneer Cement’s profit beats estimate buoyed by strong margins
MG News | September 18, 2024 at 11:48 AM GMT+05:00
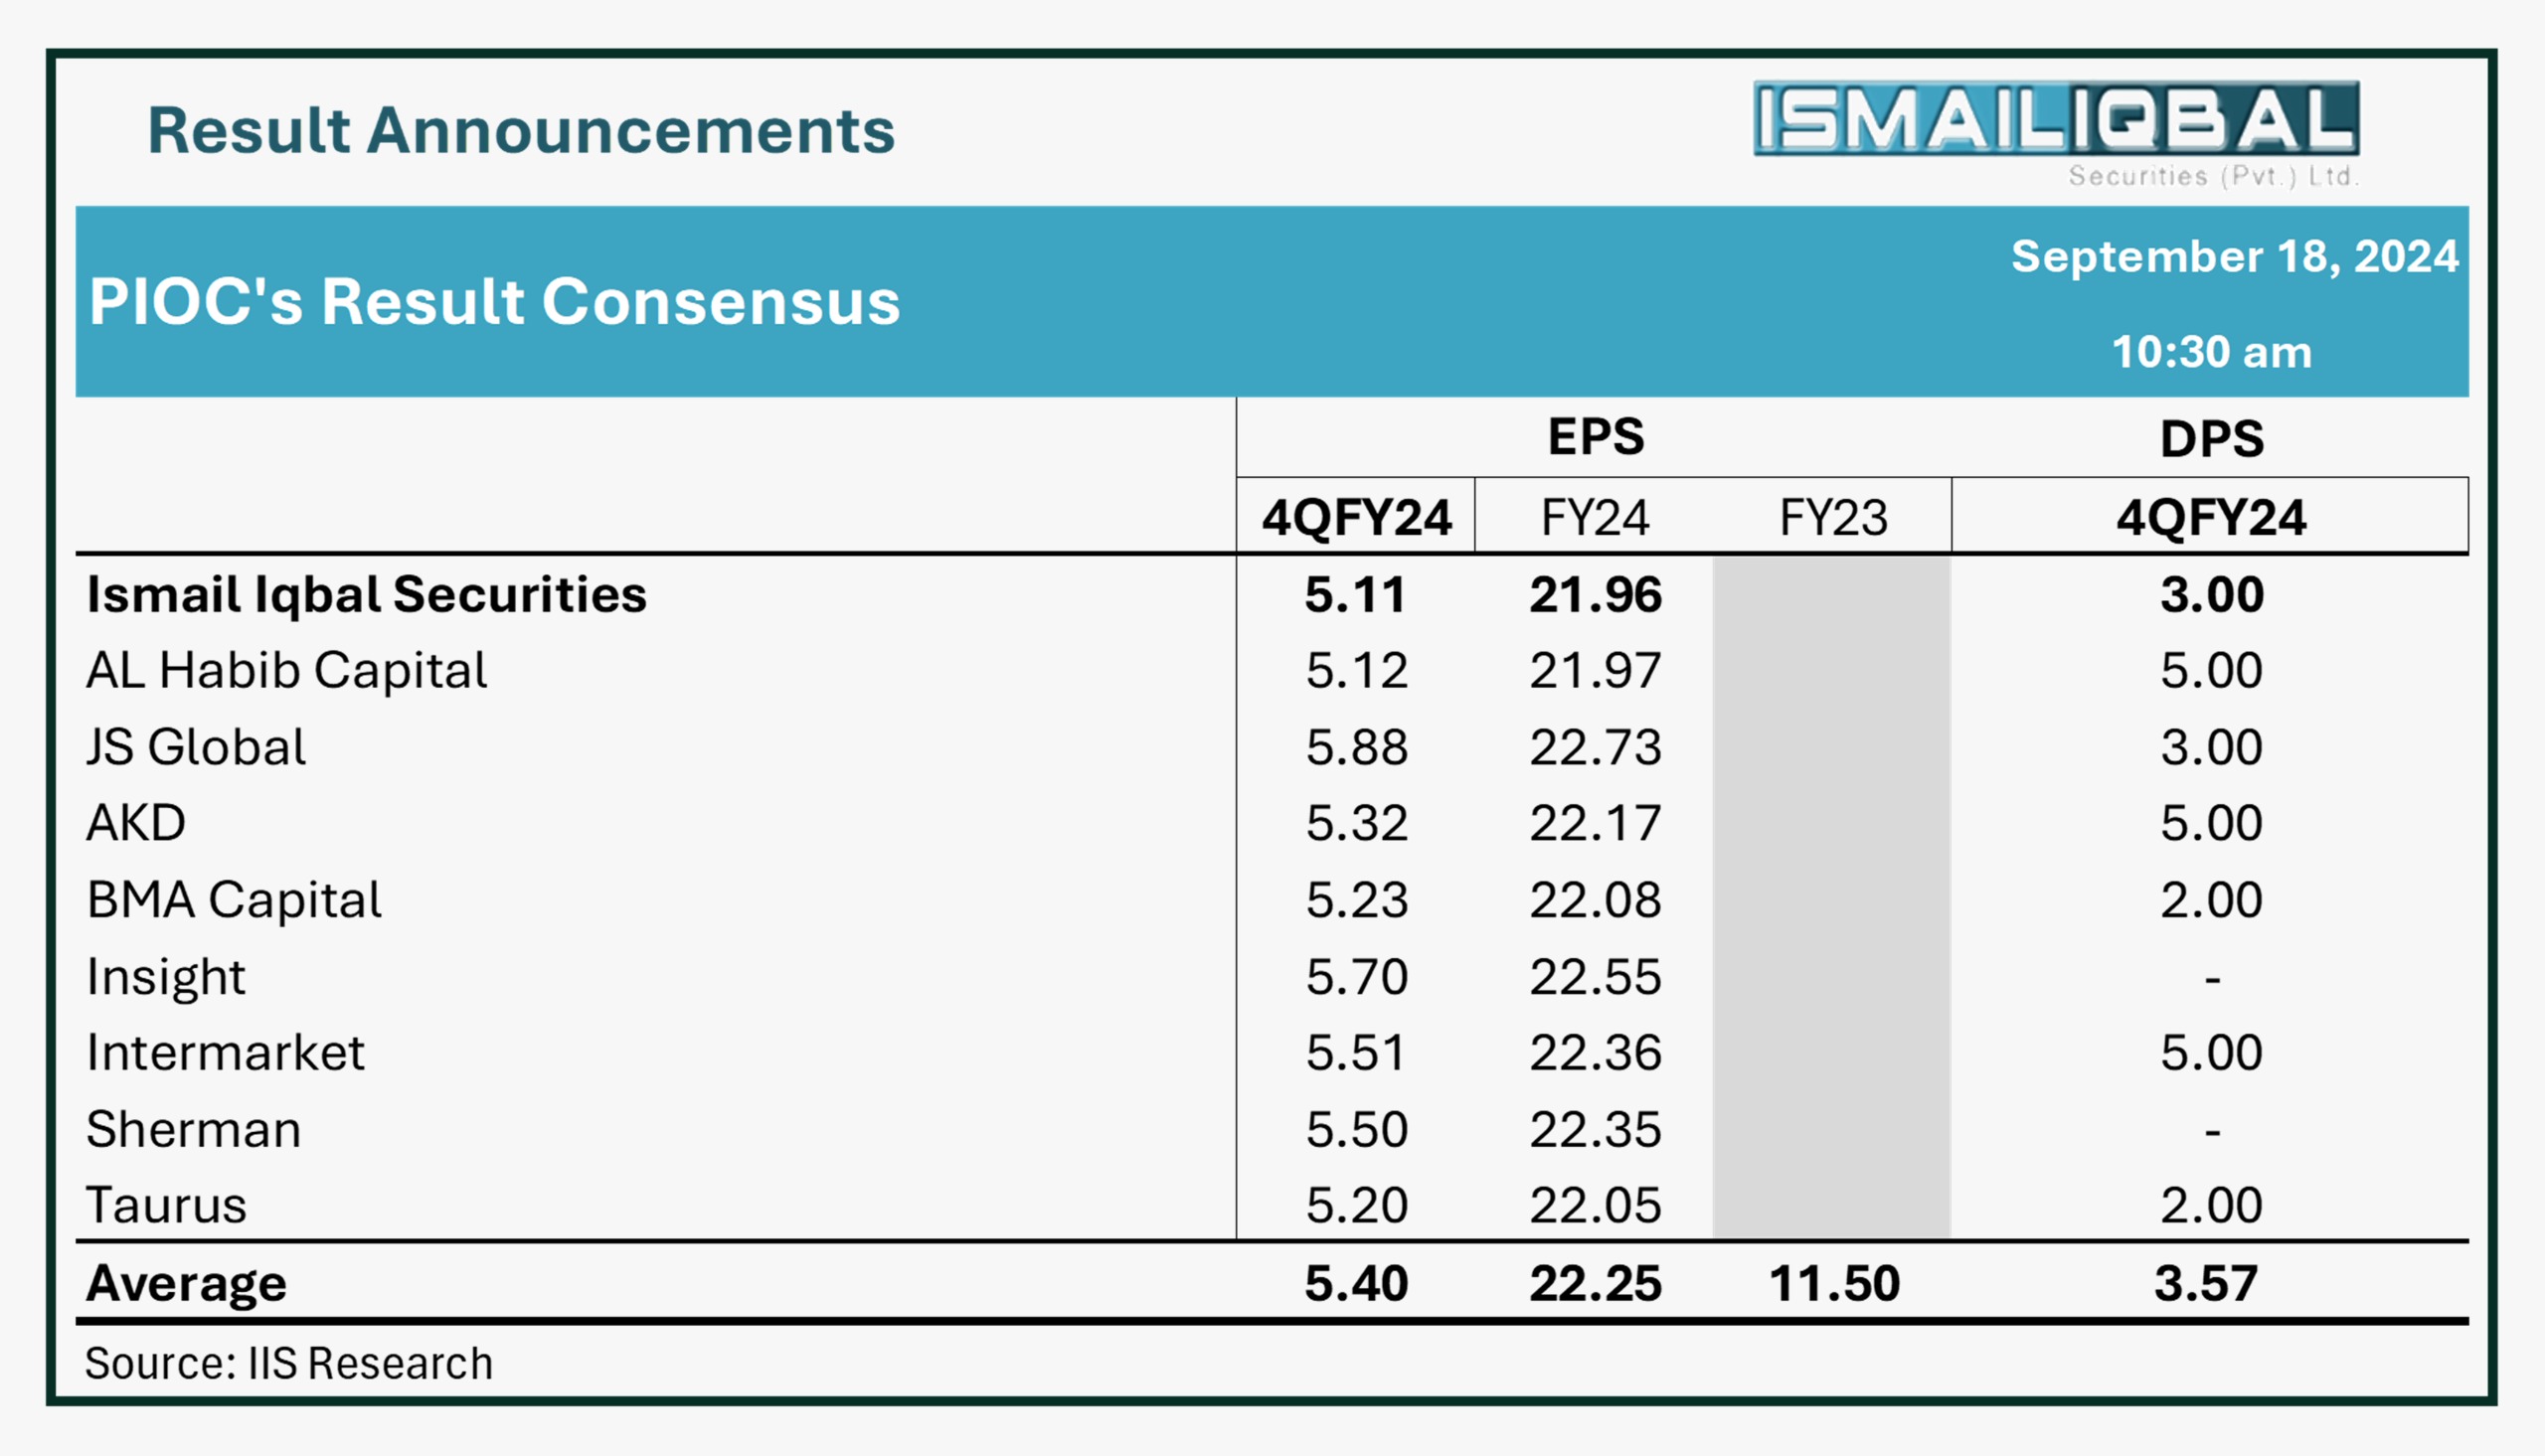
September 18, 2024 (MLN): Pioneer Cement Limited (PSX: PIOC) posted a profit after tax of Rs1.35 billion [EPS: Rs5.94] in the quarter ending June 2024 and announced a final cash dividend of Rs10 per share.
That compares with industry expectations of Rs5.40 per share and a loss per share of Rs0.44 incurred in the same period last year (SPLY).
The strong performance was led by an increase in gross margins and a significantly lower tax rate.
Going by the results, the company's revenue fell 2.7% to Rs8.14bn as compared to Rs8.37bn in SPLY.
However, the cost of sales decreased by 14.3%, improving the gross profit by 29.3% to Rs2.88bn in Q4 FY24.
The gross margins rose to 35.4% as compared to 26.6% in SPLY.
Other income rose to Rs261.72m in Q4 FY24 as compared to just Rs8.3m in SPLY.
On the expense side, the company's administrative expenses rose 87.2% from a year ago to Rs94.02m, while selling and distribution expenses fell 44.3% to Rs26.81m.
The company’s finance cost inched lower by 2.3% and stood at Rs550.01m as compared to Rs562.66m in SPLY.
On the tax front, the company paid a significantly lower tax worth Rs759.58m against the Rs1.84bn paid in the corresponding period of last year, depicting a decrease of 58.6%.
This translates to an effective tax rate of 36.0% as compared to 105.8% in SPLY.
| Unconsolidated (un-audited) Financial Results for quarter ended June 30, 2024 (Rupees in '000) | |||
|---|---|---|---|
| Jun 24 | Jun 23 | % Change | |
| Sales | 8,144,344 | 8,369,202 | -2.69% |
| Cost of sales | (5,263,680) | (6,141,614) | -14.29% |
| Gross Profit/ (loss) | 2,880,664 | 2,227,588 | 29.32% |
| Administrative Expenses | (94,023) | (50,229) | 87.19% |
| Selling And Distribution Expenses | (26,805) | (48,082) | -44.25% |
| Other Gains / (Losses) | (190,254) | (66,182) | 187.47% |
| Provision Reversed / (Charged) | (47,879) | - | - |
| Other Income | 261,716 | 8,295 | 3055.11% |
| Other Operating Expenses | (125,760) | 226,489 | - |
| Finance Cost | (550,011) | (562,657) | -2.25% |
| Profit/ (loss) before taxation | 2,107,648 | 1,735,222 | 21.46% |
| Taxation | (759,579) | (1,835,346) | -58.61% |
| Net profit/ (loss) for the period | 1,348,069 | (100,124) | - |
| Basic earnings/ (loss) per share | 5.94 | (0.44) | - |
Amount in thousand except for EPS
Copyright Mettis Link News
Related News


| Name | Price/Vol | %Chg/NChg |
|---|---|---|
| KSE100 | 150,398.71 270.15M | -1.06% -1612.55 |
| ALLSHR | 90,084.08 469.39M | -0.93% -849.88 |
| KSE30 | 45,453.36 99.47M | -1.14% -522.50 |
| KMI30 | 218,271.12 195.05M | -0.92% -2019.44 |
| KMIALLSHR | 58,965.48 294.49M | -0.81% -483.69 |
| BKTi | 41,775.34 33.94M | -0.76% -317.96 |
| OGTi | 31,328.42 11.96M | -0.61% -192.61 |
| Symbol | Bid/Ask | High/Low |
|---|
| Name | Last | High/Low | Chg/%Chg |
|---|---|---|---|
| BITCOIN FUTURES | 67,165.00 | 67,625.00 66,480.00 | -15.00 -0.02% |
| BRENT CRUDE | 109.24 | 109.74 99.08 | 8.08 7.99% |
| RICHARDS BAY COAL MONTHLY | 112.50 | 0.00 0.00 | 6.40 6.03% |
| ROTTERDAM COAL MONTHLY | 113.00 | 114.50 113.00 | -0.40 -0.35% |
| USD RBD PALM OLEIN | 1,175.00 | 1,175.00 1,175.00 | 0.00 0.00% |
| CRUDE OIL - WTI | 112.06 | 113.97 97.50 | 11.94 11.93% |
| SUGAR #11 WORLD | 14.96 | 15.50 14.91 | -0.33 -2.16% |
Chart of the Day
Latest News
Top 5 things to watch in this week
Pakistan Stock Movers
| Name | Last | Chg/%Chg |
|---|
| Name | Last | Chg/%Chg |
|---|