Pakistan’s stock market P/E at 10Y lows
MG News | June 16, 2023 at 03:41 PM GMT+05:00
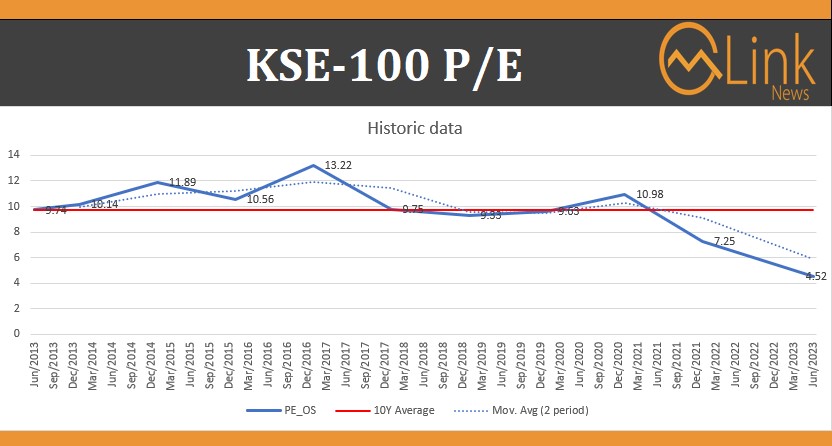
June 16, 2023 (MLN): The P/E ratio for the KSE100 Index is currently at its lowest point in June 2023 (4.52x) and has fluctuated over time, with the highest in the last 10Y in 2017 (13.22x).
Generally, the P/E ratio has been relatively low in recent years, with a downward trend since 2021, with the 10Y average P/E at 9.73x.
Meanwhile, currently, banks are trading at 0.5x P/B and 2.8x P/E vs. their historic 10-yr average of 1.07x P/B and 7.8x P/E.
Mattias Martinsson, founder and chief investment officer at Tundra Fonder stated that these market prices anticipate a collapse in profits and an economic standstill, which has yet to materialize. The significant jump in profits over the past 12 months is mainly attributed to devaluation.
Pakistan’s current valuation vs historic (P/BV and P/E) is approaching 2 standard deviations lower than the 10Y average.
#Pakistan curr. valuation vs historic: P/BV and P/E, approaching 2 standard deviations (sd) lower than the 10y average. Market prices in a collapse in profits and standstill of the economy. Yet to materialize. Last 12 months of profit jump mainly due to devaluation. pic.twitter.com/VcyAVJrjzt
— Mattias Martinsson (@Tundra_CIO) June 16, 2023
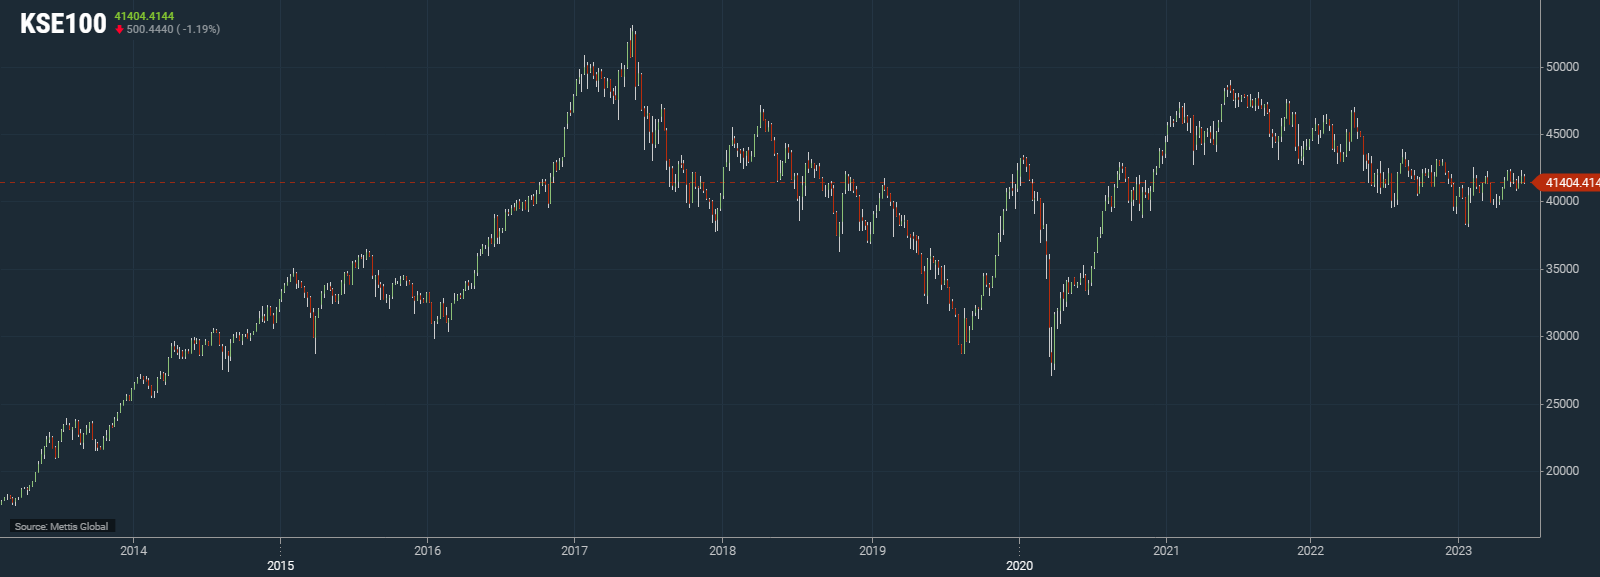
KSE-100 performance (2013-2023)
The P/E ratio, or price-to-earnings ratio, is a financial metric used to assess the valuation of a company or an index. It is calculated by dividing the current market price of a security by its earnings per share (EPS).
Copyright Mettis Link News
Related News


| Name | Price/Vol | %Chg/NChg |
|---|---|---|
| KSE100 | 165,428.12 284.46M | 1.49% 2433.95 |
| ALLSHR | 99,023.28 555.18M | 1.54% 1497.37 |
| KSE30 | 49,851.08 147.31M | 1.55% 760.85 |
| KMI30 | 237,565.19 162.08M | 1.48% 3467.43 |
| KMIALLSHR | 64,221.12 325.85M | 1.48% 936.54 |
| BKTi | 46,027.13 43.69M | 1.25% 569.03 |
| OGTi | 33,801.66 8.71M | 1.93% 638.77 |
| Symbol | Bid/Ask | High/Low |
|---|
| Name | Last | High/Low | Chg/%Chg |
|---|---|---|---|
| BITCOIN FUTURES | 80,095.00 | 81,015.00 78,605.00 | 1320.00 1.68% |
| BRENT CRUDE | 109.44 | 110.98 105.55 | 1.27 1.17% |
| RICHARDS BAY COAL MONTHLY | 113.00 | 0.00 0.00 | 1.00 0.89% |
| ROTTERDAM COAL MONTHLY | 108.50 | 108.55 108.50 | 1.05 0.98% |
| USD RBD PALM OLEIN | 1,191.50 | 1,191.50 1,191.50 | 0.00 0.00% |
| CRUDE OIL - WTI | 102.82 | 104.54 99.11 | 0.88 0.86% |
| SUGAR #11 WORLD | 14.97 | 0.00 0.00 | 0.02 0.13% |
Chart of the Day
Latest News
Top 5 things to watch in this week
Pakistan Stock Movers
| Name | Last | Chg/%Chg |
|---|
| Name | Last | Chg/%Chg |
|---|