Indus Motor shifts gears: Profits accelerate 2.5x YoY

MG News | October 27, 2023 at 10:32 AM GMT+05:00

October 27, 2023 (MLN): Indus Motor Company Limited (PSX: INDU) recorded an increase of around 2.5x YoY in its profitability in the first quarter of FY24, clocking in its profit after tax at Rs3.22 billion [EPS: Rs40.91], compared to a profit of Rs1.3bn [EPS: Rs16.5] in the same period last year (SPLY).
Along with the results, the company announced an interim cash dividend for the quarter at Rs25.5 per share.
Going by the results made available by the company on the PSX, the automobile assemblers's top line dipped by 12.29% YoY to Rs32.67bn as compared to Rs37.25bn in SPLY.
However, it managed to cut its cost of sales to Rs29.37bn in 1QFY24 as compared to Rs39.61bn in SPLY.
During the period under review, other income slid by 45.36% YoY to stand at Rs2.82bn in 1QFY24 as compared to Rs5.16bn in SPLY.
On the expense side, the company observed an increase in distribution expenses by 2.91% YoY while almost eliminating other expenses with a cut of 90.56% YoY to clock in at Rs383.13m and Rs8.24m respectively during the review period.
The company’s finance costs increased by 61.20% YoY and stood at Rs31.12m as compared to Rs19.31m in 1QFY24, mainly due to higher interest rates.
On the tax front, the company paid a higher tax worth Rs1.71bn against the Rs541.81m paid in the corresponding period of last year, depicting an increase of 215.65% YoY.
| Unconsolidated (un-audited) Financial Results for Quarter ended 30 September, 2023 (Rupees in '000) | |||
|---|---|---|---|
| Sep 23 | Sep 22 | % Change | |
| Sales | 32,670,646 | 37,248,747 | -12.29% |
| Cost of sales | (29,370,522) | (39,606,294) | -25.84% |
| Gross Profit | 3,300,124 | (2,357,547) | -% |
| Distribution expenses | (383,130) | (372,284) | 2.91% |
| Administrative expenses | (535,703) | (450,241) | 18.98% |
| Workers' Profit Participation Fund and workers' Welfare Fund | (237,123) | (37,526) | 531.89% |
| Other Income | 2,821,134 | 5,163,025 | -45.36% |
| Other expenses | (8,243) | (87,330) | -90.56% |
| Finance cost | (31,121) | (19,306) | 61.20% |
| Profit before taxation | 4,925,938 | 1,838,791 | 167.89% |
| Taxation | (1,710,234) | (541,814) | 215.65% |
| Net profit for the period | 3,215,704 | 1,296,977 | 147.94% |
| Basic earnings/ (loss) per share | 40.91 | 16.50 | - |
Amount in thousand except for EPS
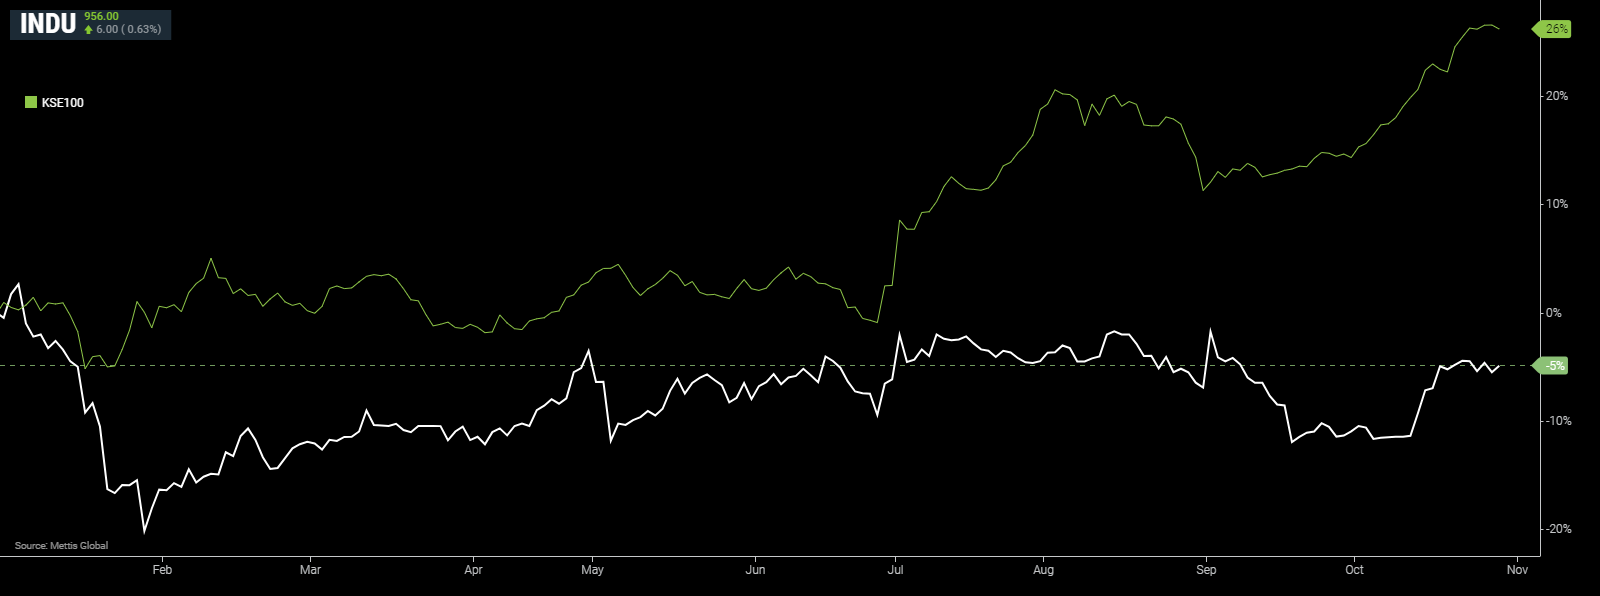
INDU and KSE-100 YTD Performance
Copyright Mettis Link News
Related News
_20260709115743732_48c8c7.png?width=280&height=140&format=Webp)


| Name | Price/Vol | %Chg/NChg |
|---|---|---|
| KSE100 | 181,259.68 470.84M | -0.20% -369.69 |
| ALLSHR | 109,929.76 975.62M | -0.01% -12.56 |
| KSE30 | 54,098.62 128.04M | -0.33% -180.86 |
| KMI30 | 255,607.53 154.75M | -0.30% -762.24 |
| KMIALLSHR | 70,648.66 584.40M | 0.03% 21.76 |
| BKTi | 51,158.12 47.42M | -0.71% -368.09 |
| OGTi | 36,542.82 7.90M | -0.63% -231.76 |
| Symbol | Bid/Ask | High/Low |
|---|
| Name | Last | High/Low | Chg/%Chg |
|---|---|---|---|
| BITCOIN FUTURES | 62,840.00 | 63,460.00 61,795.00 | 410.00 0.66% |
| BRENT CRUDE | 78.42 | 79.25 76.75 | 0.40 0.51% |
| RICHARDS BAY COAL MONTHLY | 105.75 | 0.00 0.00 | -2.50 -2.31% |
| ROTTERDAM COAL MONTHLY | 119.00 | 119.50 118.50 | -0.60 -0.50% |
| USD RBD PALM OLEIN | 1,135.00 | 1,135.00 1,135.00 | 0.00 0.00% |
| CRUDE OIL - WTI | 73.70 | 75.13 72.37 | 0.18 0.24% |
| SUGAR #11 WORLD | 15.01 | 15.09 14.89 | -0.10 -0.66% |
Chart of the Day
Latest News
Top 5 things to watch in this week
Pakistan Stock Movers
| Name | Last | Chg/%Chg |
|---|
| Name | Last | Chg/%Chg |
|---|