
Weekly Market Roundup
_20261003091117717_68b87c.jpeg?width=950&height=450&format=Webp)
MG News | October 03, 2026 at 02:15 PM GMT+05:00

October 03, 2026 (MLN): The benchmark KSE-100
Index closed the week ended October 2, 2026, at 168,155.49 points, losing
2,609.73 points or 1.53% week-on-week from 170,765.22 points recorded on
September 25, 2026.
The decline came amid persistent volatility in global oil
markets, renewed concerns over inflationary pressures, and lingering
uncertainty surrounding the US-Iran diplomatic situation, which kept investors
cautious and weighed on buying activity at the Pakistan Stock Exchange.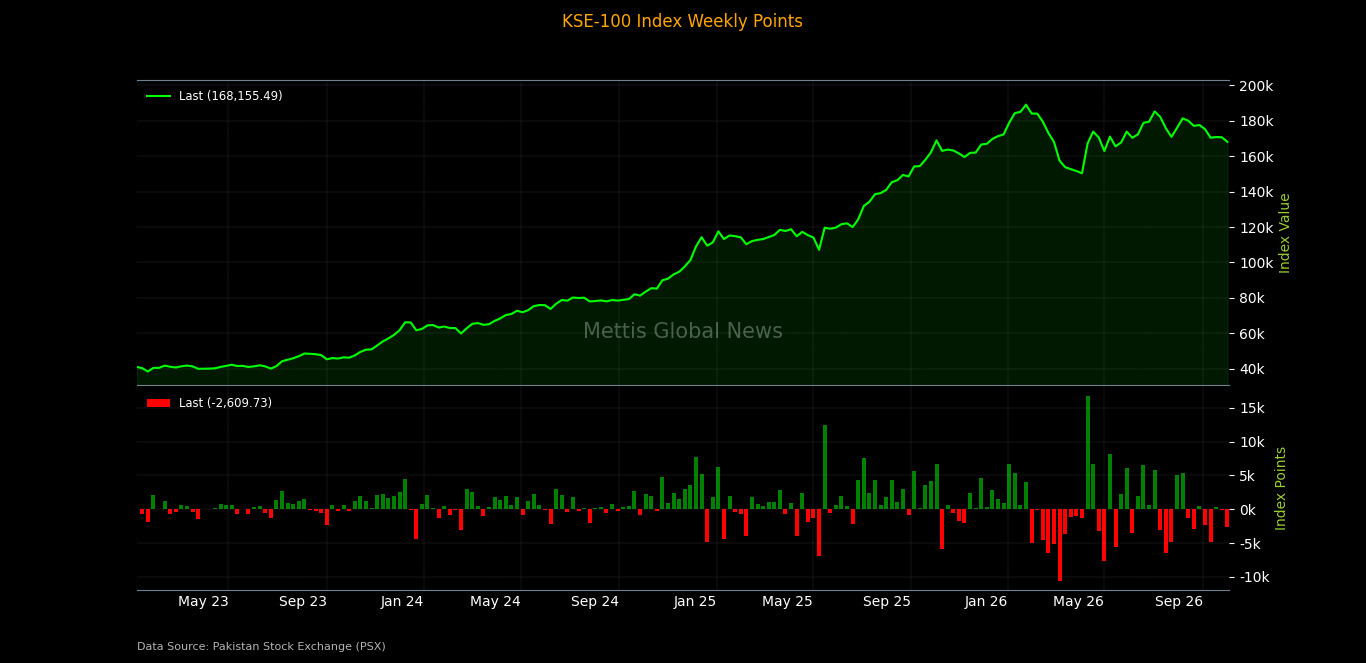
Market Capitalization
The Pakistan Stock Exchange's market capitalization declined
to Rs4.753 trillion during the week, compared with Rs4.805tr on September 25,
2026, registering a decrease of approximately Rs52.40bn, or 1.09% WoW.
In dollar terms, market capitalization fell from $17.336bn
to $17.153bn, declining by approximately $183.47m, or 1.06% WoW._20261003091126449_a2e43b.jpeg)
The market's USD-adjusted return stood at -1.50%, compared
with -0.04% in the previous week, reflecting a weaker performance after
accounting for currency movements.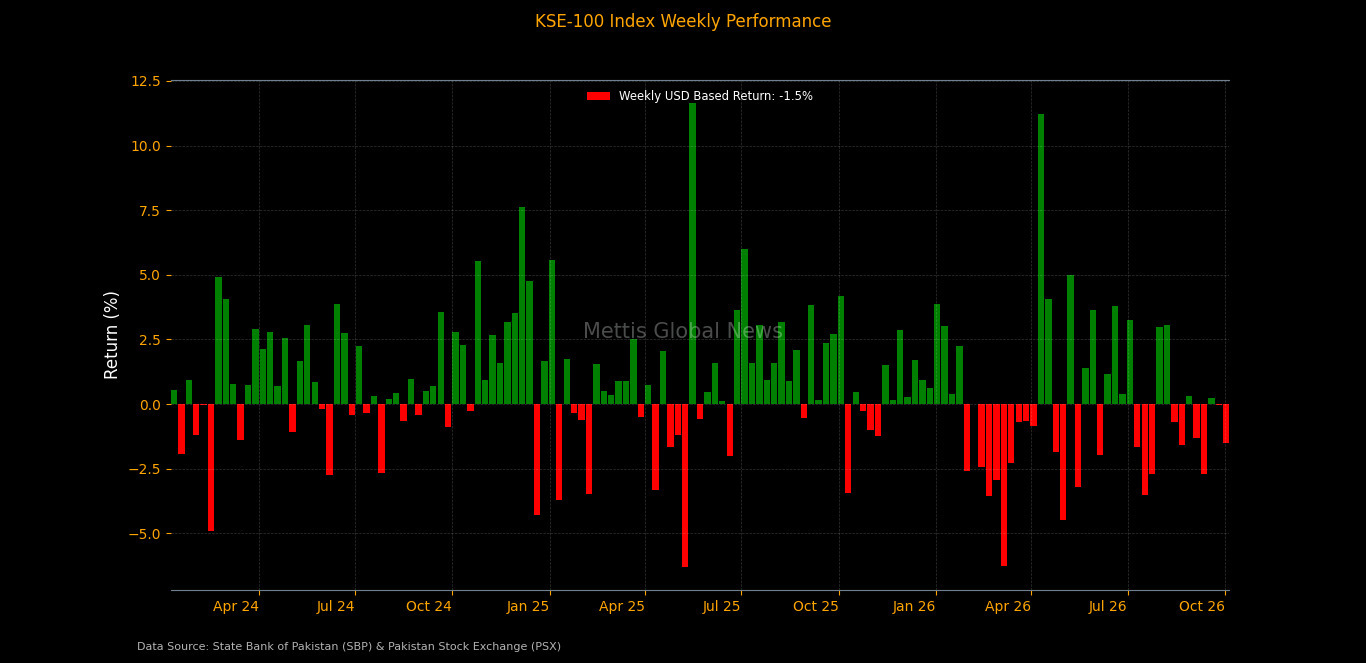
On the macroeconomic front, Pakistan’s
merchandise trade deficit widened 7.99% MoM to $3.56 billion in September
2026, as imports rose 11.5% to $6.49bn despite a 16.07% increase in exports to
$2.94bn.
During 1QFY27, the trade deficit expanded 15.13% YoY to
$10.79bn, driven by import growth outpacing exports.
Pakistan’s
annual CPI inflation eased to 10.3% in September 2026 from 11.1% in August,
while monthly inflation accelerated to 1.3% from 1.2%, according to PBS data.
Average inflation during 1QFY27 rose to 10.2%, compared with
4.3% in the same period last year, while annual wholesale inflation climbed to
13.3%.
The State Bank of Pakistan (SBP) increased its net
foreign exchange purchases from the interbank market by 5.5% to $8.104
billion in FY26, compared with $7.684bn in the preceding fiscal year.
The State Bank of Pakistan raised
Rs880.06bn through the latest MTB auction against bids of Rs2.73tr, while
cut-off yields rose across the 3-month, 6-month and 12-month tenors.
Index Movers
Sector-wise performance remained broadly negative during the
week. Commercial Banks emerged as the largest drag on the KSE-100 Index,
shedding 596.70 points, followed by Cement at 427.49 points and Oil & Gas
Exploration Companies at 304.21 points.
Other major negative contributors included Power Generation
& Distribution at 180.37 points, Technology & Communication at 174.08
points, Miscellaneous at 161.06 points, Food & Personal Care Products at
125.17 points,
Oil & Gas Marketing Companies at 109.26 points,
Pharmaceuticals at 105.24 points, Investment Banks / Investment Companies /
Securities Companies at 101.72 points, Fertilizer at 97.56 points, Automobile
Assembler at 92.90 points, Textile Composite at 58.52 points, Transport at
26.51 points,
Real Estate Investment Trust at 22.51 points, Cable &
Electrical Goods at 21.96 points, Engineering at 15.28 points, Property at
13.99 points, Insurance at 9.99 points, Glass & Ceramics at 7.68 points,
Paper, Board & Packaging at 5.46 points,
Chemical at 5.00 points, Automobile Parts & Accessories
at 4.65 points, Modarabas at 3.64 points, Apparel at 2.28 points, Tobacco at
1.62 points, Close-End Mutual Funds at 1.03 points, Textile Spinning at 0.51
points, Woollen at 0.28 points, Sugar & Allied Industries at 0.19 points,
and Leasing Companies at 0.17 points.
On the upside, Refinery provided the largest sectoral
support, adding 44.42 points, followed by Leather & Tanneries at 19.42
points, Vanaspati & Allied Industries at 2.98 points, Textile Weaving at
0.28 points, and Synthetic & Rayon at 0.20 points.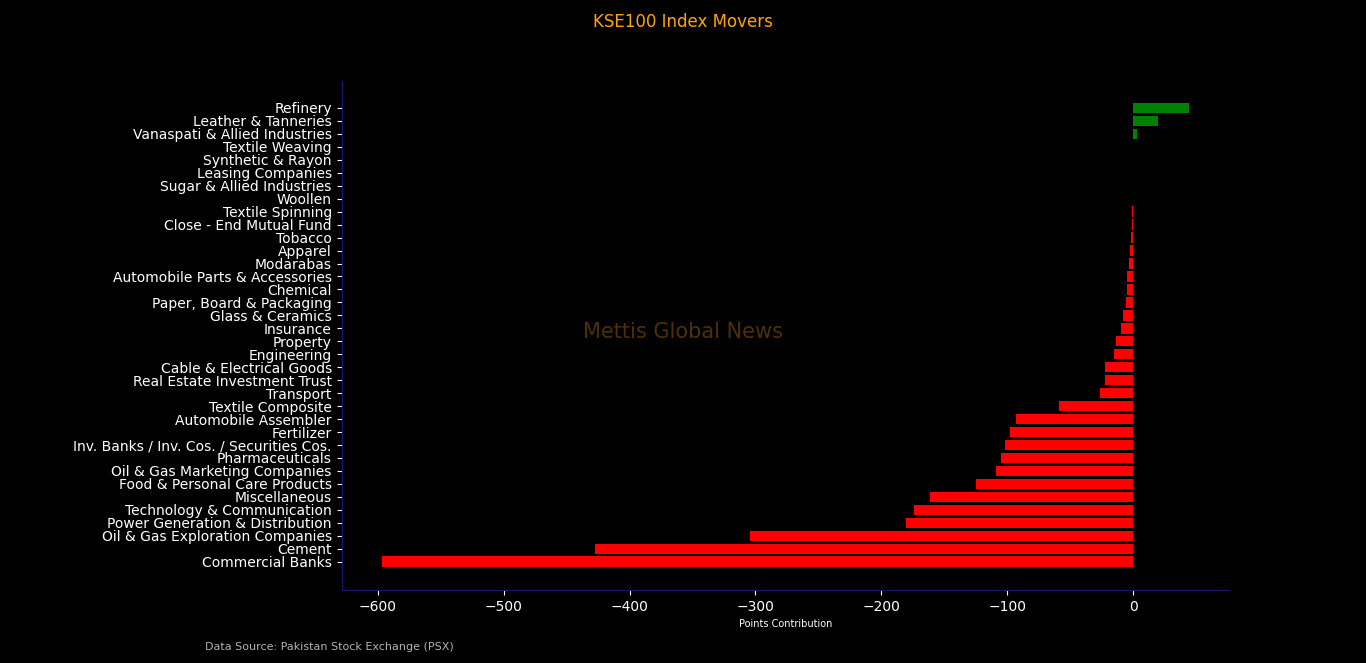
Among individual stocks, ATRL emerged as the largest
positive contributor to the index, adding 66.79 points, followed by POL at
31.95 points, TRG at 24.31 points, SRVI at 19.42 points,
MEBL at 11.20 points, LOTCHEM at 9.97 points, UPFL at 9.39
points, AHCL at 5.88 points, INDU at 4.63 points, SSOM at 2.98 points, KAPCO at
1.63 points, SCBPL at 1.51 points, PABC at 0.96 points, ATLH at 0.65 points,
HALEON at 0.64 points, YOUW at 0.28 points, and IBFL at 0.20 points.
On the downside, PPL was the largest drag on the benchmark,
erasing 261.60 points, followed by UBL at 207.17 points, PSEL at 150.68 points,
SYS at 121.35 points, HUBC at 114.73 points, HBL at 109.11 points, LUCK at
94.32 points, ENGROH at 89.69 points, FCCL at 87.35 points,
MLCF at 76.51 points, FFC at 66.00 points, DGKC at 65.76
points, NBP at 62.17 points, PSO at 60.51 points, AKBL at 57.01 points, NESTLE
at 56.71 points, PTC at 52.60 points, SAZEW at 45.37 points, HMB at 42.94
points, GAL at 41.00 points, MARI at 37.62 points,
OGDC at 36.94 points, NPL at 36.76 points, COLG at 36.67
points, SEARL at 36.55 points, CHCC at 35.67 points, NML at 33.92 points, BAHL
at 30.36 points, EFERT at 28.77 points, BAFL at 28.17 points, KOHC at 27.10
points, PIBTL at 26.51 points, GHNI at 25.46 points,
NATF at 25.17 points, AIRLINK at 22.47 points, CNERGY at
22.37 points, HINOON at 21.78 points, NCPL at 21.73 points, AGP at 20.72
points, BOP at 20.54 points, MCB at 18.59 points, FABL at 18.42 points, TPLRF1
at 17.97 points, ABOT at 16.01 points, THCCL at 15.93 points,
ILP at 15.54 points, LCI at 14.97 points, PIOC at 14.30
points, JVDC at 13.99 points, BML at 13.02 points, FFL at 12.16 points, SSGC at
12.06 points, PSX at 12.03 points, SHFA at 11.34 points, APL at 9.60 points,
KEL at 8.78 points, FATIMA at 8.67 points, POWER at 8.30 points,
KTML at 8.23 points, TGL at 7.17 points, ISL at 5.98 points,
MTL at 5.98 points, CPHL at 5.86 points, PKGS at 5.46 points, GLAXO at 4.95
points, THALL at 4.65 points, DCR at 4.54 points, FHAM at 3.64 points, MUREB at
3.20 points, IMAGE at 2.28 points,
BWCL at 2.25 points, HUMNL at 1.97 points, ABL at 1.91
points, PAKT at 1.62 points, HGFA at 1.03 points, MEHT at 0.83 points, RMPL at
0.66 points, GHGL at 0.51 points, GADT at 0.51 points, BNWM at 0.28 points,
JDWS at 0.19 points, and PGLC at 0.17 points.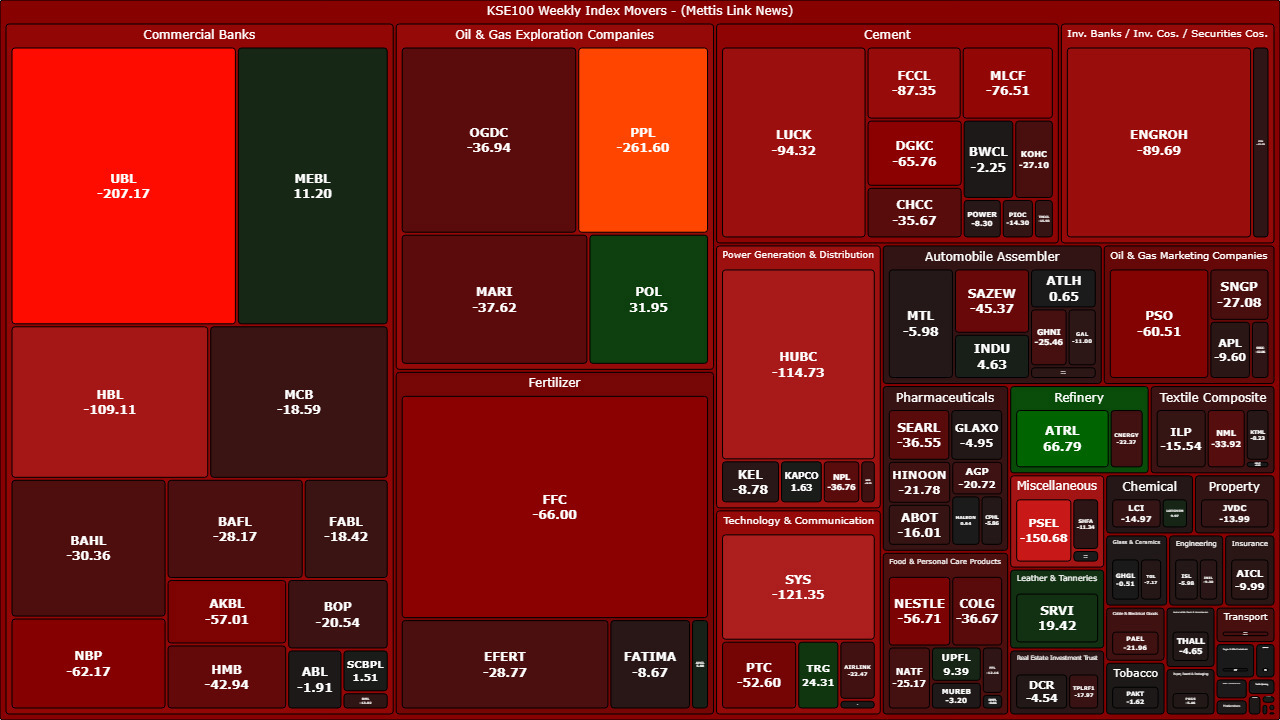
FIPI/LIPI
Foreign investors remained net buyers in the equity market
during the week, recording net purchases of Rs110.72m ($399,715). Overseas
Pakistanis led foreign equity buying with net purchases of Rs509.63m ($1.84m),
while Foreign Corporates recorded net sales of Rs393.96m ($1.42m).
Foreign Individuals recorded net equity sales of Rs4.94m
($17,849).
Including debt flows, foreign investors recorded net
purchases of Rs109.17m ($394,123). Overseas Pakistanis recorded net debt sales
of Rs1.55m ($5,592).
On the local side, investors recorded net equity sales of
Rs110.72 million ($399,711), broadly offsetting foreign investors' net equity
purchases.
Companies emerged as the largest local equity buyers,
recording net purchases of Rs1.43bn ($5.18m), followed by Individuals with
Rs1.25bn ($4.51m) and NBFCs with Rs9.98m ($36,024).
Meanwhile, Mutual Funds remained the largest local equity
sellers, with net sales of Rs1.69bn ($6.10m), followed by Broker Proprietary
Trading with Rs644.43m ($2.33m),
Banks/DFIs with Rs234.96m ($848,225), Other Organizations
with Rs184.53m ($666,179), and Insurance Companies with Rs51.52m ($185,992).
In the debt market, Banks/DFIs recorded the largest net
purchases at Rs57.63bn ($208.05m), followed by Other Organizations with Rs1.19bn
($4.29m), Individuals with Rs205.53m ($741,972), and Broker Proprietary Trading
with Rs163.69m ($590,944).
Meanwhile, Mutual Funds remained the largest debt-market
sellers, recording net sales of Rs58.65bn ($211.75m), followed by Insurance
Companies with Rs530.36m ($1.91m) and NBFCs with Rs2.36m ($8,521).
Overall, foreign investors recorded net purchases of
Rs109.17m ($394,123) across equity and debt markets, while local investors
recorded net sales of approximately Rs109.17m ($394,122), leaving the combined
net flow close to neutral._20261003091144471_fef0b0.jpeg)
Copyright Mettis Link News
Related News



| Name | Price/Vol | %Chg/NChg |
|---|---|---|
| KSE100 | 162,374.88 110.96M | -0.95% -1549.44 |
| ALLSHR | 98,620.11 386.58M | -0.91% -906.77 |
| KSE30 | 47,823.16 51.47M | -1.02% -490.65 |
| KMI30 | 232,733.99 57.93M | -1.23% -2903.19 |
| KMIALLSHR | 63,955.68 197.75M | -1.12% -727.41 |
| BKTi | 44,724.17 14.61M | -1.01% -457.04 |
| OGTi | 33,033.72 5.00M | -1.08% -361.88 |
| Symbol | Bid/Ask | High/Low |
|---|
| Name | Last | High/Low | Chg/%Chg |
|---|---|---|---|
| BITCOIN FUTURES | 81,625.00 | 81,920.00 81,055.00 | 170.00 0.21% |
| BRENT CRUDE | 114.26 | 115.00 112.74 | 1.09 0.96% |
| RICHARDS BAY COAL MONTHLY | 128.50 | 0.00 0.00 | -1.55 -1.19% |
| ROTTERDAM COAL MONTHLY | 147.10 | 0.00 0.00 | 1.80 1.24% |
| USD RBD PALM OLEIN | 1,182.50 | 1,182.50 1,182.50 | 0.00 0.00% |
| CRUDE OIL - WTI | 100.63 | 101.35 98.84 | 1.16 1.17% |
| SUGAR #11 WORLD | 20.36 | 20.47 20.02 | 0.23 1.14% |
Chart of the Day
Latest News
Top 5 things to watch in this week
 Repatriation of Profit and Dividend
Pakistan Stock Movers
| Name | Last | Chg/%Chg |
|---|
| Name | Last | Chg/%Chg |
|---|