Weekly Market Roundup

MG News | March 07, 2026 at 12:28 PM GMT+05:00

March 07, 2026 (MLN): Pakistan’s equity market
remained under heavy selling pressure during the outgoing week, as the
benchmark KSE-100 Index closed at 157,496.10, compared to 168,062.17
recorded on February 27, 2026.
The index lost 10,566.07 points over the week,
translating into a decline of 6.29% week-on-week (WoW), as aggressive
selling in banking, cement, fertilizer, and technology stocks dragged the
benchmark sharply lower.
Investor sentiment remained weak during the week amid rising
global uncertainty and geopolitical tensions in the Middle East.
The uncertain external environment prompted investors to
adopt a cautious stance, leading to profit-taking across major sectors and
adding to the overall selling pressure in the market._20260307072354173_1a698a.jpeg)
Market Capitalization
Market capitalization mirrored the sharp decline in the
benchmark index. The total listed market cap dropped to Rs4.62 trillion on
March 6, 2026, compared to Rs4.96tr recorded on February 27, 2026,
marked a contraction of approximately Rs333.75bn or 6.73% WoW.
In dollar terms, total market capitalization declined
by $1.19bn during the week, compared to a decline of $538.64m in the
previous week, highlighting the intensity of equity market losses._20260307070943715_07a0c0.jpeg)
Meanwhile, dollar-adjusted returns stood at negative
6.26%, compared to negative 2.92% in the prior week, indicating that
the bulk of the decline was driven by falling equity prices rather than
currency movements._20260307070936522_05d249.jpeg)
Periodic Drawdowns
The long-term performance of the KSE-100 Index reflects a
powerful multi-year bull cycle, characterized by strong upward momentum
interspersed with periodic corrections.
From mid-2023 onward, the index entered a steep upward
trajectory, supported by improving macroeconomic stability, easing external
account pressures, and robust domestic liquidity.
This rally eventually pushed the benchmark to an all-time
high near 189,167 points.
However, the latest reading of around 157,496 points
indicates a drawdown of approximately 16.7% from the peak, marking one
of the sharper corrections within the recent bull cycle.
While the decline appears significant in the short term, the
chart shows that the average drawdown historically hovers around the
mid-single-digit range (roughly 6–7%), suggesting that such pullbacks are
not unusual during extended market uptrends.
Historically, the Pakistan Stock Exchange has witnessed even
deeper and more prolonged corrections, particularly during episodes of
political uncertainty, currency volatility, or tightening financial conditions.
The current pullback therefore represents a meaningful
but still cyclical correction within a broader long-term uptrend,
highlighting the market’s tendency to experience sharp interim declines even
during sustained bullish phases.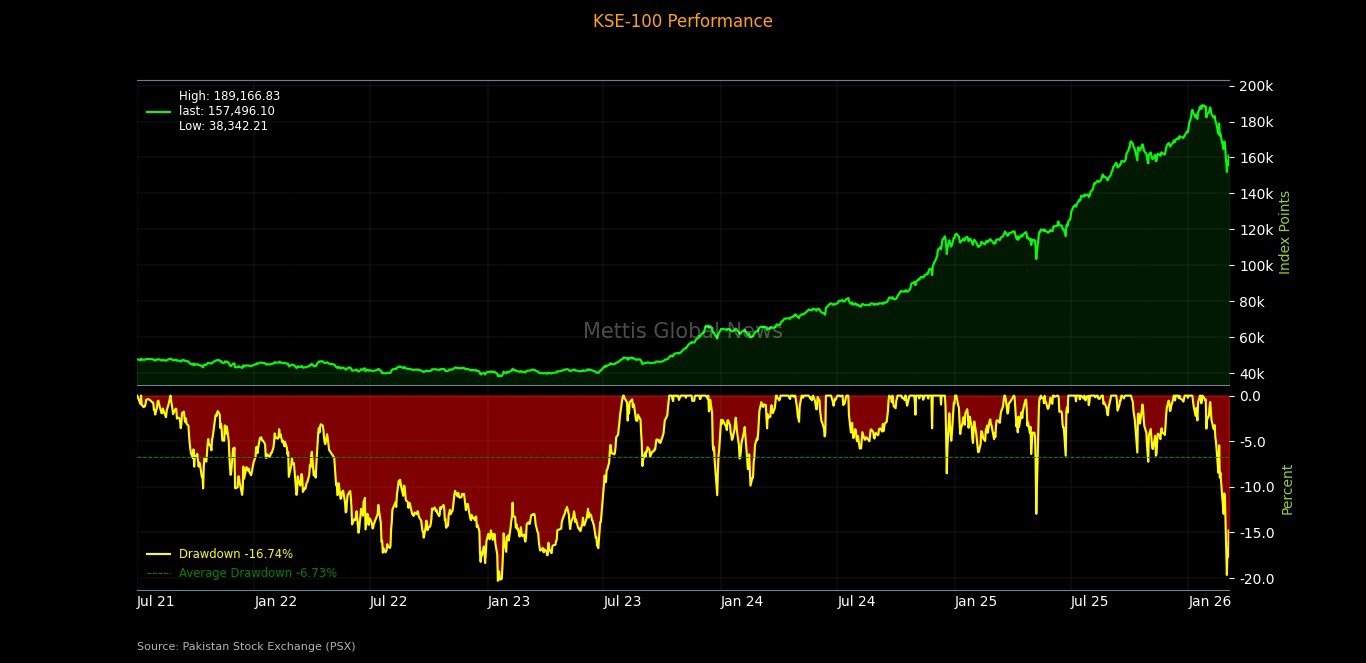
On the macroeconomic front, National Savings Schemes (NSS)
mobilization rebounded 545%
MoM to Rs27.01bn in January, recovering from December’s sharp slowdown
but remaining 28.8% lower YoY for FY2025-26.
Pakistan’s central government debt rose 9.98%
YoY to Rs79.32tr in January 2026, driven by higher domestic and
external borrowing to finance the fiscal deficit.
SBP raised Rs581.7bn
through MTBs in the latest auction, while rejecting all bids for
10-year floating-rate PIBs, as cut-off yields jumped up to 39bps across
tenors, signaling rising rate expectations.
Pakistan’s
trade deficit widened 8.4% MoM to $2.98bn in February 2026 as
exports plunged 25.6%, outweighing the decline in imports.
Pakistan’s
CPI inflation rose to 7% YoY in February 2026, the highest
since October 2024, as price pressures picked up from 5.8% in January.
Index Movers
Sector-wise performance highlighted widespread selling
pressure across the market.
Commercial banks emerged as the largest drag, erasing
3,916.43 index points, followed by cement which shaved 1,511.18
points from the benchmark.
Fertilizer stocks reduced the index by 959.32
points, while technology and communication trimmed 642.84 points.
Investment banks and securities companies dragged the index down by 584.02
points, while pharmaceuticals contributed a decline of 515.10
points.
Other sectors that weighed heavily on the benchmark included
textile composite, automobile assemblers, power generation companies, food
and personal care products, oil marketing companies, engineering, and chemicals,
reinforcing the broad-based nature of the market downturn.
On the positive side, gains were extremely limited. Refineries
added 33.63 points, while oil and gas exploration companies contributed
a marginal 5.91 points, and sugar sector stocks provided a small
positive contribution of 2.03 points.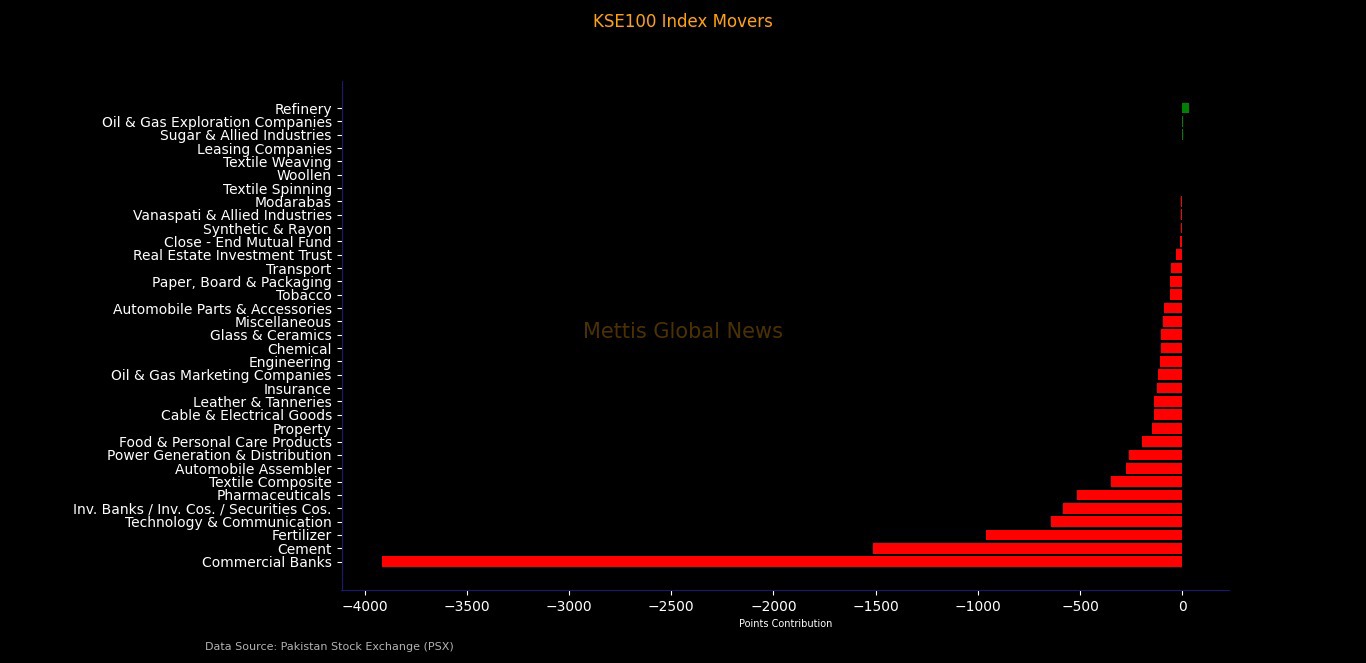
At the company level, only a handful of stocks managed to
record positive contributions.
Among the gainers, MARI added 97.82 points,
followed by ATRL which contributed 52.30 points, and POL
which added 28.81 points. K-Electric (KEL) also provided modest
support to the index with 14.01 points.
Despite these gains, the benchmark remained under
significant pressure due to sharp declines in several heavyweight stocks.
UBL emerged as the largest drag, wiping out 1,140.50
points from the index. HBL followed with a 637.55-point decline,
while FFC erased 632.26 points.
LUCK dragged the index down by 584.34 points,
while ENGROH reduced it by 525.05 points. Systems Limited
(SYS) also weighed heavily on the benchmark with a decline of 435.66
points.
Other notable decliners included MCB, BAHL, BAFL, AKBL,
HUBC, FATIMA, MEBL, FCCL, and DGKC, reflecting strong selling pressure in
major large-cap stocks.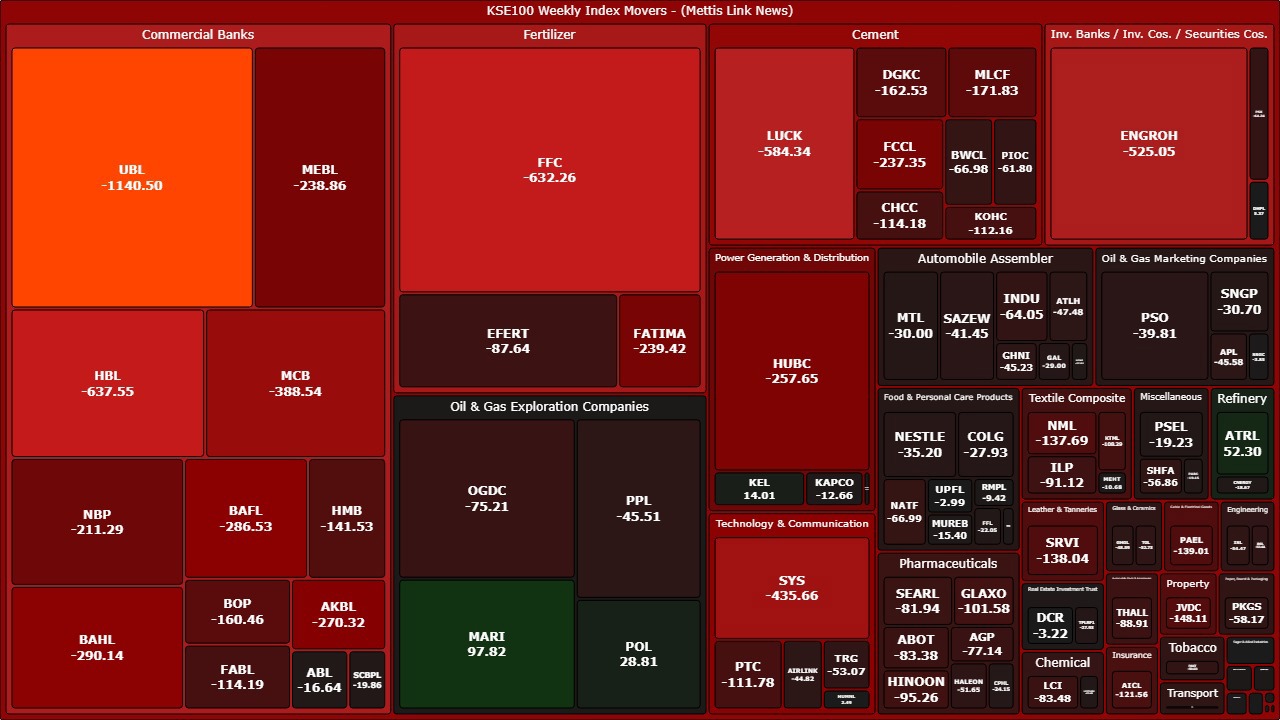
FIPI / LIPI
Foreign investment flows continued to exert pressure on the
market during the week.
Under Foreign Portfolio Investment (FIPI), foreign
investors remained net sellers with an outflow of $22.11m.
The majority of the selling came from foreign corporates,
which offloaded $29.69m worth of equities, while overseas Pakistanis
provided buying support of $7.56m. Foreign individuals recorded marginal
net buying of $23.7k.
On the other hand, local investors absorbed the entire
foreign outflow, resulting in a matching net inflow of $22.11m under
Local Portfolio Investment (LIPI).
Within local participants, banks and DFIs emerged as the
largest buyers with net purchases of $34.51m, followed by insurance
companies ($14.12m), companies ($14.95m), other organizations
($10.25m), and individual investors ($6.75m).
Meanwhile, mutual funds recorded the largest selling with
an outflow of $55.97m, followed by broker proprietary trading desks
($2.37m) and NBFCs ($0.14m).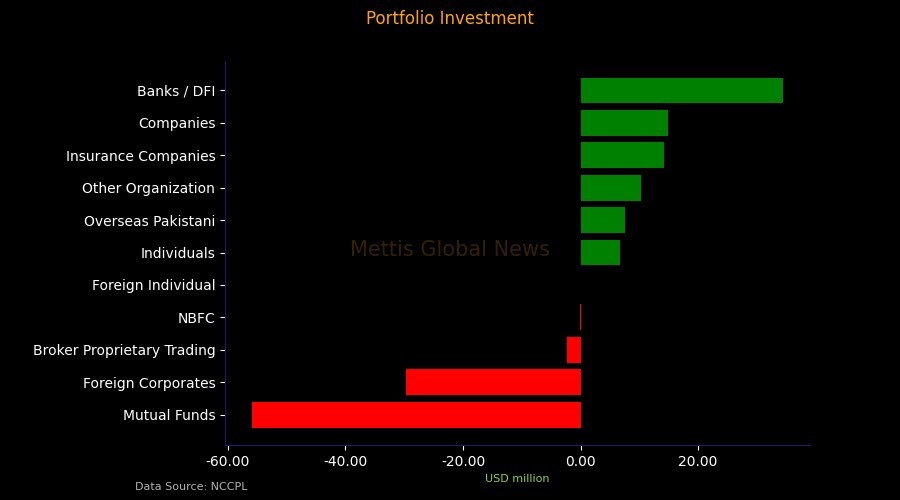
Copyright Mettis Link News
Related News


_20260529073616622_a5048c.jpeg?width=280&height=140&format=Webp)
| Name | Price/Vol | %Chg/NChg |
|---|---|---|
| KSE100 | 179,927.05 365.01M | -1.27% -2314.73 |
| ALLSHR | 109,270.69 838.76M | -1.19% -1312.98 |
| KSE30 | 53,705.71 89.34M | -1.33% -726.00 |
| KMI30 | 253,531.92 109.38M | -1.32% -3382.29 |
| KMIALLSHR | 70,152.63 543.97M | -1.25% -888.68 |
| BKTi | 50,997.50 18.73M | -1.38% -715.26 |
| OGTi | 36,216.08 8.18M | -1.21% -443.50 |
| Symbol | Bid/Ask | High/Low |
|---|
| Name | Last | High/Low | Chg/%Chg |
|---|---|---|---|
| BITCOIN FUTURES | 63,040.00 | 64,680.00 62,605.00 | -1045.00 -1.63% |
| BRENT CRUDE | 78.54 | 79.80 77.28 | 2.53 3.33% |
| RICHARDS BAY COAL MONTHLY | 105.75 | 0.00 0.00 | -1.15 -1.08% |
| ROTTERDAM COAL MONTHLY | 118.00 | 0.00 0.00 | 0.65 0.55% |
| USD RBD PALM OLEIN | 1,135.00 | 1,135.00 1,135.00 | 0.00 0.00% |
| CRUDE OIL - WTI | 73.85 | 75.08 72.61 | 2.44 3.42% |
| SUGAR #11 WORLD | 14.84 | 14.98 14.65 | -0.04 -0.27% |
Chart of the Day
Latest News
Top 5 things to watch in this week
Pakistan Stock Movers
| Name | Last | Chg/%Chg |
|---|
| Name | Last | Chg/%Chg |
|---|