Inflation trajectory vulnerable to global, domestic shocks

MG News | June 11, 2026 at 04:28 PM GMT+05:00

June 11, 2026 (MLN): Pakistan's inflation trajectory remains vulnerable to global energy and commodity price movements, geopolitical developments, domestic supply conditions, and exchange rate stability, according to the Economic Survey 2025-26.
The continued coordination between federal and provincial authorities, prudent fiscal and monetary management, and effective supply-chain oversight will be critical to limiting the pass-through of external shocks to domestic prices.
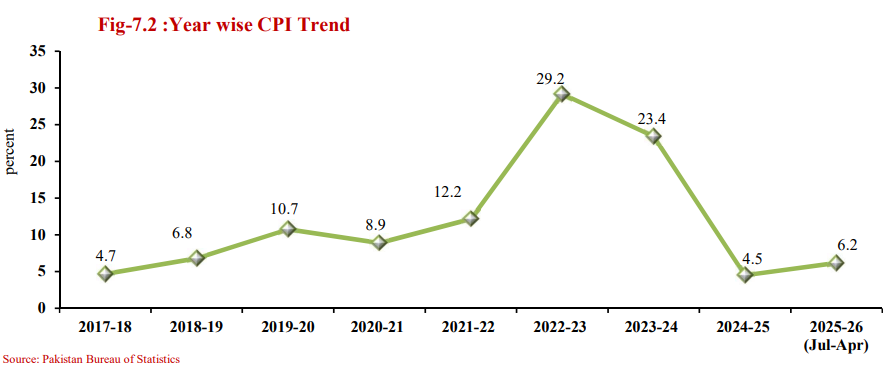
Against this backdrop, Pakistan's consumer price inflation averaged 6.2% during July-April FY2026, compared to 4.7% in the corresponding period last year.
The increase was driven largely by base effects and higher external energy costs rather than broad-based domestic demand pressures, with underlying inflation remaining relatively contained through most of the fiscal year.
April spike distorts the picture
The April 2026 reading of 10.9% year-on-year drew attention,
but needs context. In April 2025, CPI had stood at just 0.3% an exceptionally
low base making the year-on-year comparison sharper than underlying conditions
warranted.
Non-food inflation surged to nearly 14% in both urban and
rural areas in April, primarily reflecting higher energy, transport,
electricity, and related production costs.
Core inflation which strips out food and energy told a
more moderate story, edging up to 8.0 percent in urban areas from 7.4% in April
2025, while actually declining in rural areas from 9.0% to 8.5%.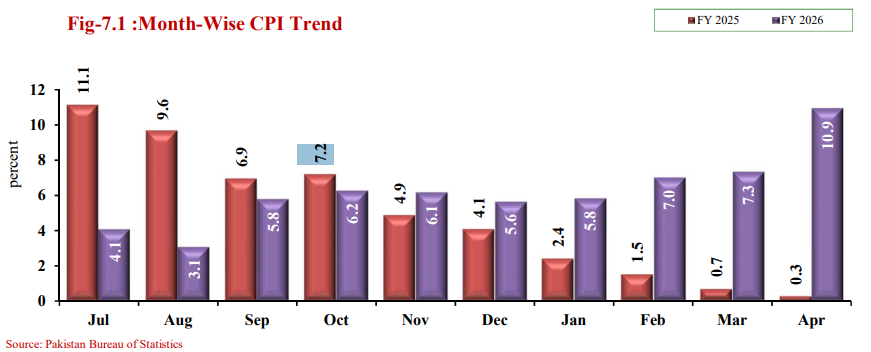
Category breakdown: Miscellaneous leads, food provides relief
Among major CPI groups, Miscellaneous recorded the steepest
inflation at 18.4%, up from 12.8% last year. Education posted 9.8%, Transport
rebounded to 7.2% after recording deflation of 1.1% in FY2025, and Housing,
Water, Electricity, Gas and Other Fuels with a substantial 23.6 percent weight
in the basket posted 7.3% inflation.
On the softer side, Perishable Food Items saw a sharp
deflation of 7.9%, showing improved supply conditions and seasonal factors.
Communication inflation collapsed to just 0.6 percent from 7.3%, and Recreation
and Culture turned negative at -3.7%.
Urban and Rural divergence
CPI Urban averaged 6.3% during July-April FY2026 against 5.7%
last year. Urban core inflation moderated to an average of 7.2% from 8.8% in
the prior period, fluctuating within a narrow 6.6–8.0% band a sign of contained
underlying pressures.
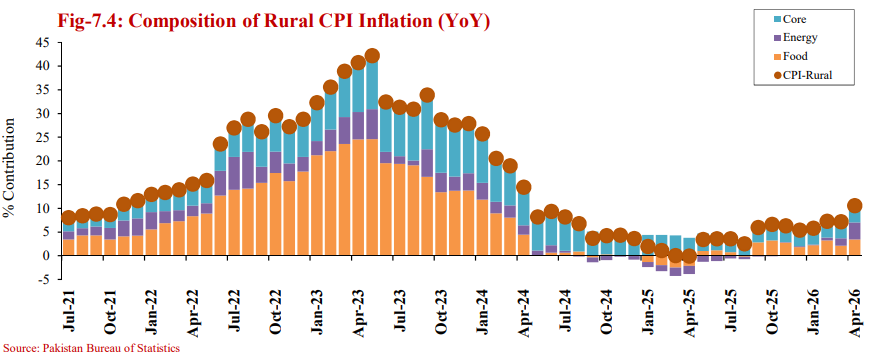
CPI Rural averaged 6.1 percent, nearly double the 3.3%
recorded in FY2025. Rural core inflation eased substantially to 8.2% from 11.6%,
though the persistence at that level suggests some stickiness remains.
Notably, rural inflation is no longer primarily food-driven non-food
items including energy, transport, and essential services are now the dominant
force shaping rural household costs.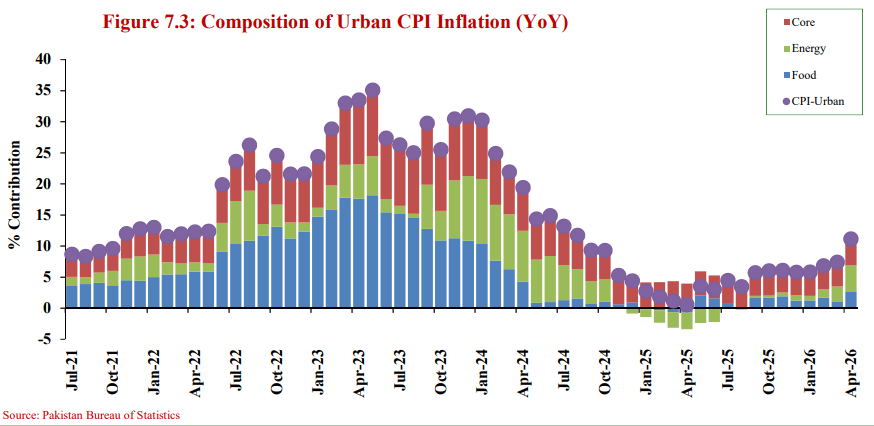
WPI and SPI: Wholesale prices contained, SPI builds toward year-end
The Wholesale Price Index averaged 2.3% during July-April
FY2026, marginally above the 2.2% recorded in the same period last year.
Agriculture, Forestry and Fishery contracted 1.6% while
Ores, Minerals, Electricity, Gas and Water eased to -0.6%, helping keep
headline WPI subdued despite Food Products and Textiles holding steady at 5.7%.
The Sensitive Price Index, a weekly tracker of 51 essential
items, averaged 4.1% during July-April FY2026 versus 4.9% in the same period
last year.
However, SPI built sharply toward the end, reaching 10.1% in
April 2026 from -0.9% in July showing that energy pass-through was beginning to
filter into essential commodity prices.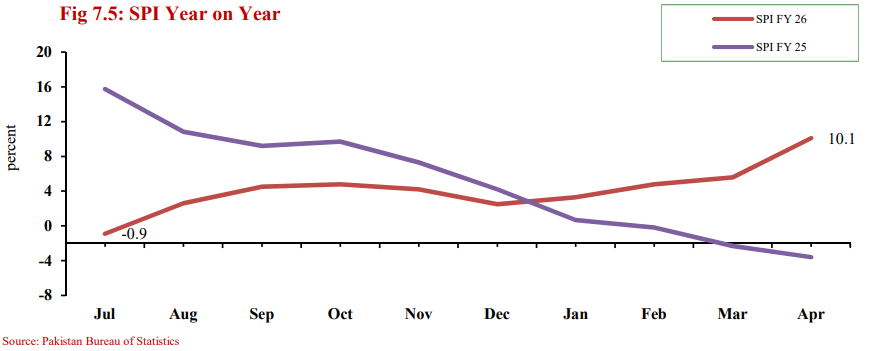
Global energy shock: The external driver
The escalation of conflict in the Middle East in February
2026 disrupted global energy supply chains, with the Strait of Hormuz through
which nearly 25–30% of global oil trade and around 20% of LNG shipments pass
coming under pressure.
The IMF's World Economic Outlook (April 2026) projected
energy commodity prices to rise 19 percent in 2026, with oil averaging around
$82 per barrel on a 21.4 percent increase.
International data confirmed the trend: crude oil rose 77.8%
year-on-year in April 2026, urea surged 121.5 percent, and soybean oil climbed
45%.
For Pakistan a net importer of petroleum products, LNG,
edible oil, and industrial raw materials these developments pose direct risks
to domestic fuel, electricity, transport, and food prices, with spillover risks
to the trade deficit and exchange rate stability.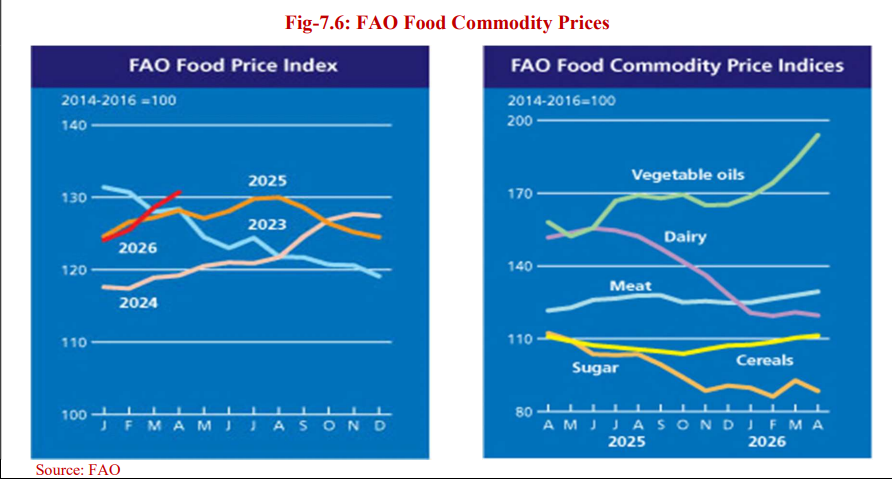
Government response
To cushion the impact of higher petroleum prices, the
Government established the Prime Minister's Austerity Fund 2026 and introduced
targeted subsidy measures in coordination with provincial governments,
particularly for two-wheelers, public transport, and freight vehicles.
The Economic Coordination Committee, National Price Monitoring Committee, and Competition Commission of Pakistan maintained active oversight of markets throughout the year. Provincial price control enforcement ranging from Punjab's 41 million inspections to ICT's 32,464 checks remained an active part of the policy response.
Copyright Mettis Link News
Related News


| Name | Price/Vol | %Chg/NChg |
|---|---|---|
| KSE100 | 180,234.21 316.07M | -1.10% -2007.57 |
| ALLSHR | 109,501.34 724.55M | -0.98% -1082.34 |
| KSE30 | 53,792.44 73.13M | -1.17% -639.27 |
| KMI30 | 253,787.81 91.88M | -1.22% -3126.41 |
| KMIALLSHR | 70,245.44 471.89M | -1.12% -795.87 |
| BKTi | 51,161.52 14.92M | -1.07% -551.25 |
| OGTi | 36,248.67 6.64M | -1.12% -410.92 |
| Symbol | Bid/Ask | High/Low |
|---|
| Name | Last | High/Low | Chg/%Chg |
|---|---|---|---|
| BITCOIN FUTURES | 63,200.00 | 64,680.00 62,605.00 | -885.00 -1.38% |
| BRENT CRUDE | 77.41 | 79.80 77.31 | 1.40 1.84% |
| RICHARDS BAY COAL MONTHLY | 105.75 | 0.00 0.00 | -1.15 -1.08% |
| ROTTERDAM COAL MONTHLY | 118.00 | 0.00 0.00 | 0.65 0.55% |
| USD RBD PALM OLEIN | 1,135.00 | 1,135.00 1,135.00 | 0.00 0.00% |
| CRUDE OIL - WTI | 72.75 | 75.08 72.65 | 1.34 1.88% |
| SUGAR #11 WORLD | 14.68 | 14.98 14.65 | -0.20 -1.34% |
Chart of the Day
Latest News
Top 5 things to watch in this week
Pakistan Stock Movers
| Name | Last | Chg/%Chg |
|---|
| Name | Last | Chg/%Chg |
|---|