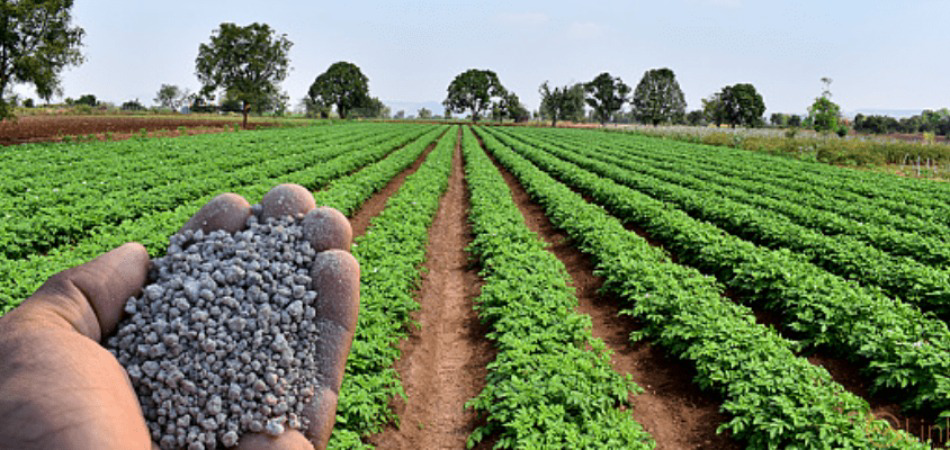
Fertilizer offtake jumps 11% YoY in June 2025

MG News | July 16, 2025 at 12:25 PM GMT+05:00
June 16, 2025 (MLN): The country’s overall nutrient offtake in June 2025 rose sharply
to 407 thousand tonnes, showing a 11% increase compared to June 2024, according
to the latest monthly fertilizer report issued by the National Fertilizer
Development Centre (NFDC).
Among major nutrients, nitrogen and potash
offtake witnessed significant increases of 15.7% and 41.2%, respectively.
Phosphate was the only nutrient to show a negative trend, declining by 6.7% year-on-year.
|
Nutrient |
June-24 (000 tons) |
June-25 (000 tons) |
Change (%) |
|
Nitrogen |
287 |
332 |
15.7% |
|
Phosphate |
78 |
73 |
-6.7% |
|
Potash |
1.6 |
2.2 |
41.2% |
Urea,
DAP
Urea offtake during June 2025 stood at 582
thousand tonnes, marking a 20.6% increase compared to June 2024.
DAP offtake decreased by 6.6% YoY, recording 115
thousand tonnes.
This drop reflected the impact of higher DAP
prices, which limited farmers’ ability to purchase fertiliser.
Urea and DAP off-take saw strong
month-on-month growth, mainly supported by peak Kharif 2025 planting activity,
better farmer incomes due to higher crop prices, and increased loan
disbursements through the Kissan Card scheme.
|
Product |
June-24 (000 tons) |
June-25 (000 tons) |
Change (%) |
|
Urea |
483 |
582 |
20.6% |
|
DAP |
123 |
115 |
-6.6% |
Fertilizer
production and imported supplies
Total domestic fertilizer production in June
2025 was 790 thousand tonnes.
Urea production was recorded at 555 thousand
tonnes, while DAP production was 75 thousand tonnes.
Production of other products i.e., NP, CAN,
SSP and SOP was 76, 74, 7.6, and 3.7 thousand tonnes, respectively.
Total imported supplies were 128.7 thousand
tonnes comprising 128 thousand tonnes of DAP, 0.5 thousand tonnes of MOP.
Supply/Demand
Situation
Total urea availability during June 2025 was 1,870
thousand tonnes, including 1,316 thousand tonnes leftover from May and 555
thousand tonnes from domestic production.
With offtake at 582 thousand tonnes, the
closing balance stood at 1,278 thousand tonnes.
DAP availability rose to 439 thousand tonnes,
sourced from 236 thousand tonnes in stock, 128 thousand tonnes of imports, and
75 thousand tonnes of local production.
After the offtake of 115 thousand tonnes, the
closing balance reached 324 thousand tonnes.
Domestic
prices
The price of urea (sona), and urea (other)
decreased by 0.5%, and 0.3%, during June 2025 as compared with the previous
month.
On the other hand, the price of DAP and CAN
decreased / increased by 1.3% and -0.6%
respectively, while prices of other phosphate fertilizer products such as NP,
and SSP changed by +1.6%, and +0.7%, respectively.
The average price of urea (sona), urea
(other), and DAP was Rs4,452, Rs4,348, and Rs12,768 per 50 kg bag,
respectively.
International
prices
The price of urea in the Chinese and Middle
East market showed an upward trend during June 2025,
Urea prices were quoted in the range of $350–420
per tonne FOB bulk in China and $375–458 per tonne in the Middle East.
DAP prices in Morocco increased by $53 per
tonne, while prices in China increased by $47 per tonne.
In June 2025, DAP prices ranged from $710–785
per tonne FOB in Morocco and $715–760 per tonne FOB in China.
MAP and TSP bulk prices ranged between $693–737
and $540–575 per tonne FOB, respectively.
Ex-Karachi price of imported urea ranged between Rs6,882 and Rs7,281 per 50 kg bag, while the price of imported DAP was in the range of Rs12,163 to Rs13,663 per 50 kg bag.
Copyright Mettis Link News
Related News
| Name | Price/Vol | %Chg/NChg |
|---|---|---|
| KSE100 | 184,129.58 798.69M | -1.97% -3702.50 |
| ALLSHR | 110,763.73 1,266.28M | -1.85% -2087.96 |
| KSE30 | 56,278.51 173.32M | -2.19% -1261.46 |
| KMI30 | 259,907.89 102.57M | -2.03% -5380.16 |
| KMIALLSHR | 71,198.64 822.49M | -1.72% -1247.03 |
| BKTi | 53,693.69 102.25M | -2.59% -1425.61 |
| OGTi | 37,589.24 28.20M | -2.72% -1052.27 |
| Symbol | Bid/Ask | High/Low |
|---|
| Name | Last | High/Low | Chg/%Chg |
|---|---|---|---|
| BITCOIN FUTURES | 66,540.00 | 66,930.00 60,005.00 | 2745.00 4.30% |
| BRENT CRUDE | 67.38 | 68.82 66.87 | -0.17 -0.25% |
| RICHARDS BAY COAL MONTHLY | 90.00 | 0.00 0.00 | -4.50 -4.76% |
| ROTTERDAM COAL MONTHLY | 101.30 | 101.30 101.30 | 0.80 0.80% |
| USD RBD PALM OLEIN | 1,071.50 | 1,071.50 1,071.50 | 0.00 0.00% |
| CRUDE OIL - WTI | 63.06 | 64.58 62.31 | -0.23 -0.36% |
| SUGAR #11 WORLD | 14.19 | 14.30 14.14 | -0.08 -0.56% |
Chart of the Day
Latest News
Top 5 things to watch in this week
Pakistan Stock Movers
| Name | Last | Chg/%Chg |
|---|
| Name | Last | Chg/%Chg |
|---|


 MTB Auction