
Breakup of Pakistan’s trade data in August: PBS

MG News | September 18, 2026 at 11:14 AM GMT+05:00

September 18, 2026 (MLN): Pakistan's trade deficit narrowed to $3.31 billion in August 2026, easing 16.24% from July's $3.95 billion gap, as a seasonal pullback in both exports and imports offered the currency and external account some breathing room.
But the relief is only sequential. Against August last year, the deficit was still 15.11% wider, indicating that import growth continues to outrun export gains on a year-on-year basis.
According to provisional data released by the Pakistan Bureau of Statistics (PBS), exports fell 13.86% month-on-month to $2.54 billion in August, down from $2.95 billion in July, even as they rose 5.22% from $2.42 billion a year earlier.
Imports contracted
15.22% MoM to $5.85 billion from $6.90 billion in July, but were up 10.59% from
$5.29 billion in August 2025. In rupee terms, exports stood at Rs705.89 billion
and imports at Rs1,625.99 billion for the month, leaving a rupee trade
shortfall of Rs920.10 billion.
The month-on-month narrowing looks less like a structural improvement and more like payback for an unusually heavy July, when the crude import bill and machinery shipments had pushed the deficit toward its widest levels of the fiscal year so far.
August 2026 Trade Snapshot
|
Indicator |
Aug 2026 |
Jul 2026 |
Aug 2025 |
MoM |
YoY |
|
Exports ($bn) |
2.54 |
2.95 |
2.42 |
-13.86% |
5.22% |
|
Imports ($bn) |
5.85 |
6.90 |
5.29 |
-15.22% |
10.59% |
|
Trade Deficit ($bn) |
-3.31 |
-3.95 |
-2.87 |
-16.24% |
15.11% |
|
Exports (Rs bn) |
705.89 |
820.57 |
683.21 |
-13.97% |
3.32% |
|
Imports (Rs bn) |
1,625.99 |
1,920.29 |
1,495.21 |
-15.33% |
8.75% |
|
Trade Deficit (Rs bn) |
-920.10 |
-1,099.72 |
-812.00 |
-16.33% |
13.31% |
Source: Pakistan Bureau of Statistics, Advance Release on External Trade Statistics, August 2026
Cumulative exports for July–August FY27 rose 7.73% YoY to $5.49 billion, but imports climbed faster, up 14.56% YoY to $12.75 billion, pushing the cumulative trade deficit to $7.25 billion, a 20.35% widening from $6.03 billion in the same period last year.
Cummulative July–August, FY2026-27 VS FY2025-26
|
Cumulative (Jul–Aug) |
FY2026-27 |
FY2025-26 |
YoY Change |
|
Exports ($bn) |
5.49 |
5.10 |
7.73% |
|
Imports ($bn) |
12.75 |
11.13 |
14.56% |
|
Trade Deficit ($bn) |
-7.25 |
-6.03 |
20.35% |
Source: Pakistan Bureau of
Statistics.
WHAT MOVED
EXPORTS
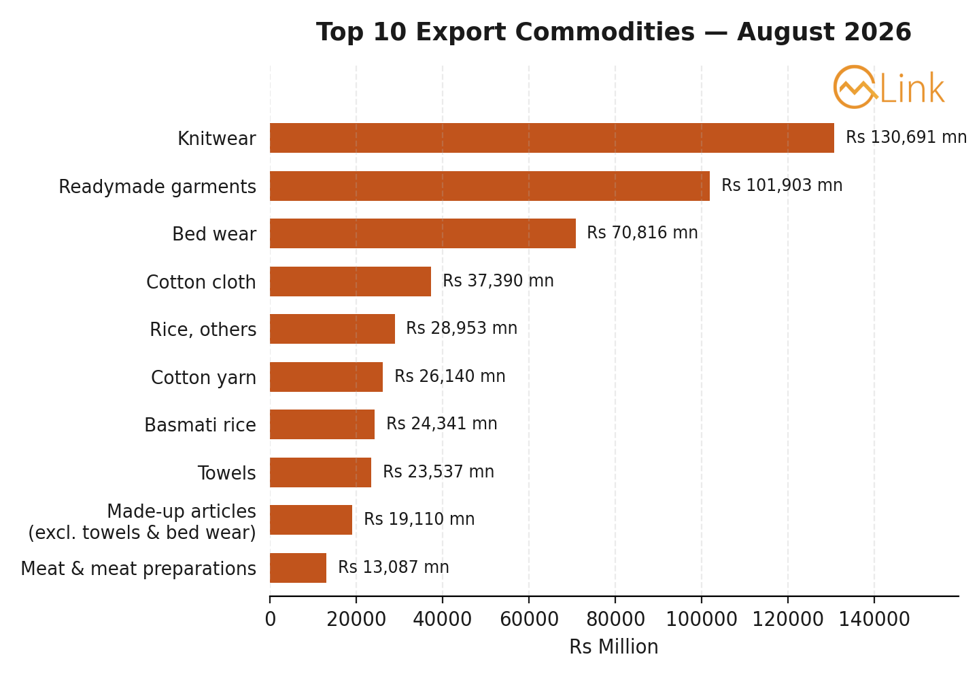
The commodity breakup shows a familiar textile-heavy export base losing momentum on a monthly basis even as select segments outperformed on a yearly one. Knitwear, the single largest export earner at Rs130.69 billion, slipped 11.94% from July but held a 3.72% YoY gain.
Readymade garments (Rs101.90 billion) fell a sharper 20.32% MoM, and
towels (Rs23.54 billion) dropped 20.41% MoM, both consistent with a seasonal
lull in Western retail ordering rather than a demand shock, given their smaller
YoY declines.
The standout performers were cotton yarn and basmati rice. Cotton yarn exports jumped 41.33% MoM and 46.42% YoY to Rs26.14 billion, while basmati rice rose 14.43% MoM and a striking 67.02% YoY to Rs24.34 billion, a combination of firmer international rice prices and stronger regional demand that is worth watching as a genuine bright spot rather than a base-effect artefact, given the size of the YoY move.
Meat
and meat preparations also posted a healthy 27.22% YoY gain, even as they were
roughly flat on the month.
WHAT MOVED
IMPORTS
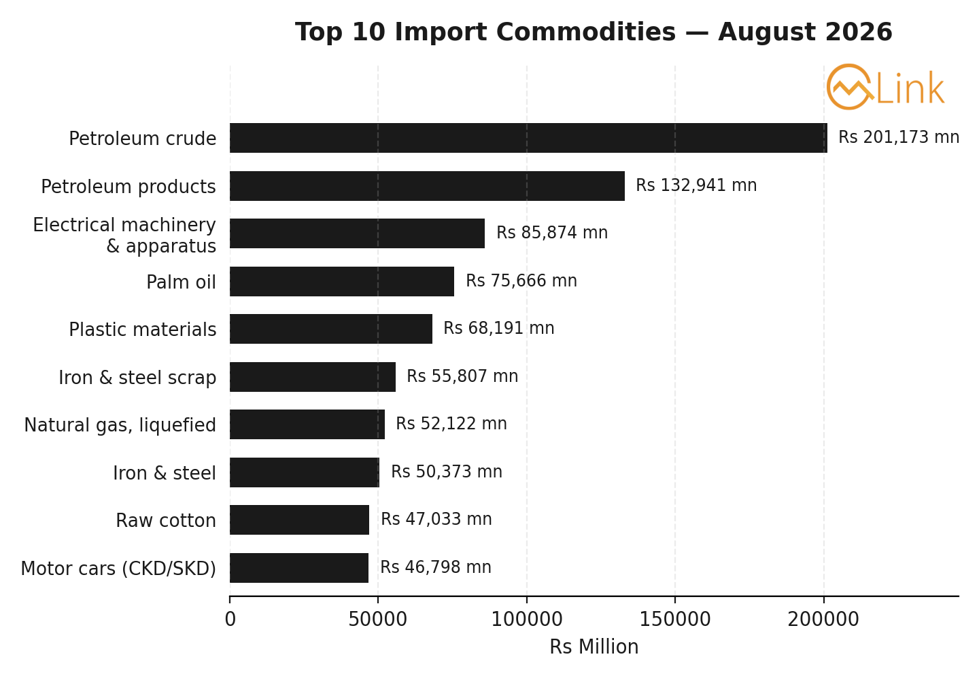
On the import side, the story is dominated by energy. Petroleum crude imports surged 39.78% MoM and 45.56% YoY to Rs201.17 billion, by far the largest single line item in the import bill, while petroleum products added a further Rs132.94 billion, up 32.54% YoY despite a mild 2.84% MoM dip.
Together, the two energy categories accounted for
roughly a fifth of total imports in August, and their year-on-year acceleration
is the clearest single driver of the widening cumulative deficit.
Elsewhere, the import picture was more mixed. Electrical machinery and apparatus imports fell 43.82% MoM but were still up 35.73% YoY, pointing to lumpy, project-linked shipments rather than a demand trend.
Palm oil (-24.28% MoM, -20.68% YoY) and iron & steel (-42.25% MoM, -21.75% YoY) both eased on both counts, offering a partial offset to the energy-driven pressure. Raw cotton imports, notably, rose 47.79% YoY even as they slipped 9.33% MoM.
Copyright Mettis Link News
Related News



| Name | Price/Vol | %Chg/NChg |
|---|---|---|
| KSE100 | 164,776.44 91.08M | -0.21% -347.97 |
| ALLSHR | 99,975.86 381.85M | -0.18% -181.83 |
| KSE30 | 48,868.27 48.36M | -0.28% -135.89 |
| KMI30 | 237,568.77 35.61M | -0.10% -245.20 |
| KMIALLSHR | 64,841.15 163.25M | -0.06% -41.61 |
| BKTi | 45,396.53 8.58M | -0.28% -125.46 |
| OGTi | 33,428.39 3.96M | -0.39% -129.64 |
| Symbol | Bid/Ask | High/Low |
|---|
| Name | Last | High/Low | Chg/%Chg |
|---|---|---|---|
| BITCOIN FUTURES | 83,640.00 | 83,670.00 83,220.00 | 255.00 0.31% |
| BRENT CRUDE | 106.61 | 106.70 106.24 | 0.92 0.87% |
| RICHARDS BAY COAL MONTHLY | 128.50 | 0.00 0.00 | 0.50 0.39% |
| ROTTERDAM COAL MONTHLY | 145.80 | 145.80 145.10 | 1.00 0.69% |
| USD RBD PALM OLEIN | 1,167.50 | 1,167.50 1,167.50 | 0.00 0.00% |
| CRUDE OIL - WTI | 94.98 | 95.02 94.51 | 0.84 0.89% |
| SUGAR #11 WORLD | 21.10 | 21.18 20.58 | 0.25 1.20% |
Chart of the Day
Latest News
Top 5 things to watch in this week
Pakistan Stock Movers
| Name | Last | Chg/%Chg |
|---|
| Name | Last | Chg/%Chg |
|---|