PSX Technicals Jul 15, 2024
.jpg)
By Abdur Rahman | July 15, 2024 at 05:30 AM GMT+05:00
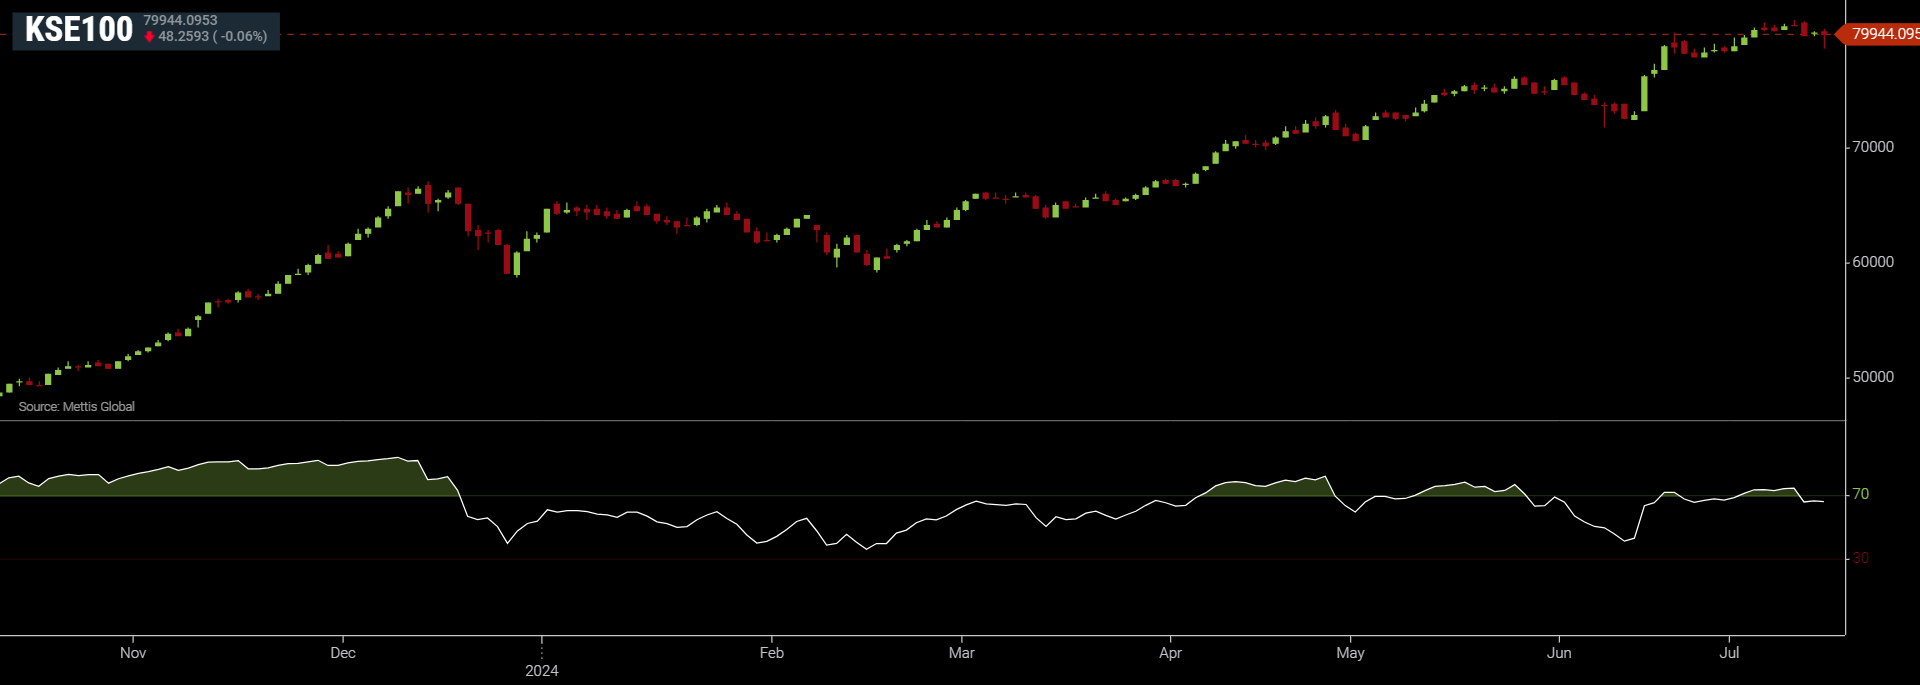
July 15, 2024 (MLN): The benchmark KSE-100 Index closed at 79,944, with the Relative Strength Index (RSI) at 66.89.
Pivot Points — a technical indicator used to determine areas of support and resistance through mathematical formulas — indicate a possible cushion for KSE-100 around 78,930.
Meanwhile, it suggests an initial resistance level at 80,640, with further barriers at 81,336 and 82,350.
KSE-100 Index closed 2.95% below the upper limit of its 20-day Bollinger band and 6.43% above the lower limit.
The gap between the upper and lower Bollinger of KSE-100 Index has narrowed by 30.5% compared to last week.
The Bollinger study is a way of analyzing volatility, calculated by plotting standard deviations, above and below a security over time. The bands widen when a security's price becomes more volatile and narrow when it is more stable.
Momentum-wise, only 13 of the 100-Index companies' RSI — a 0-100 gauge meter — has climbed above the level of 70 typically seen as overbought.
Furthermore, overall technical ratings — a technical analysis tool that combines the ratings of several technical indicators — rate 11 of the 100 index companies as a 'Strong Buy', 45 as 'Buy', 25 as 'Sell', and only 5 as 'Strong Sell'.
| Symbol | Close | RSI | Recommendation |
|---|---|---|---|
| ATRL | 362.57 | 49.34 | Neutral |
| BAFL | 67.44 | 54.68 | Buy |
| BAHL | 114.16 | 62.03 | Buy |
| CHCC | 163.62 | 54.60 | Strong Buy |
| COLG | 1184.82 | 28.86 | Sell |
| DGKC | 88.36 | 47.86 | Neutral |
| EFERT | 169.03 | 61.68 | Buy |
| ENGRO | 326.03 | 40.78 | Sell |
| FFC | 170.42 | 70.35 | Buy |
| HBL | 146.63 | 78.20 | Strong Buy |
| HUBC | 160.52 | 58.16 | Buy |
| LUCK | 903.24 | 48.60 | Sell |
| MARI | 2668.5 | 46.98 | Sell |
| MCB | 220.46 | 47.41 | Buy |
| MEBL | 237.19 | 50.33 | Sell |
| MLCF | 38.57 | 52.40 | Buy |
| MTL | 611.1 | 38.23 | Neutral |
| NRL | 263.24 | 41.71 | Strong Sell |
| OGDC | 130.83 | 45.83 | Sell |
| POL | 518.39 | 65.24 | Buy |
| PPL | 118.69 | 46.75 | Sell |
| PRL | 23.88 | 43.37 | Strong Sell |
| PSO | 167.99 | 44.99 | Sell |
| SEARL | 59.23 | 51.89 | Buy |
| SHEL | 146.23 | 57.48 | Buy |
| SNGP | 66.6 | 52.12 | Buy |
| SYS | 440.89 | 62.32 | Strong Buy |
| TPLP | 8.76 | 29.64 | Sell |
| TRG | 56.13 | 24.34 | Strong Sell |
| UBL | 256.11 | 62.07 | Buy |
Note: Table includes KSE-30 companies only
To note, the overall rating of the indicator includes several moving averages with different lengths, the Ichimoku Cloud, and several oscillators.
Disclaimer: The views and analysis in this article are the opinions of the author and are for informational purposes only. It is not intended to be financial or investment advice and should not be the basis for making financial decisions.
Copyright Mettis Link News
Related News


| Name | Price/Vol | %Chg/NChg |
|---|---|---|
| KSE100 | 125,627.31 258.99M |
1.00% 1248.25 |
| ALLSHR | 78,584.71 1,142.41M |
1.16% 904.89 |
| KSE30 | 38,153.79 69.25M |
0.63% 238.06 |
| KMI30 | 184,886.50 91.38M |
0.01% 13.72 |
| KMIALLSHR | 53,763.81 554.57M |
0.54% 290.61 |
| BKTi | 31,921.68 33.15M |
1.78% 557.94 |
| OGTi | 27,773.98 9.65M |
-0.40% -112.21 |
| Symbol | Bid/Ask | High/Low |
|---|
| Name | Last | High/Low | Chg/%Chg |
|---|---|---|---|
| BITCOIN FUTURES | 108,055.00 | 109,565.00 107,195.00 |
570.00 0.53% |
| BRENT CRUDE | 66.70 | 67.20 65.92 |
-0.10 -0.15% |
| RICHARDS BAY COAL MONTHLY | 97.00 | 97.00 97.00 |
1.05 1.09% |
| ROTTERDAM COAL MONTHLY | 107.65 | 107.65 105.85 |
1.25 1.17% |
| USD RBD PALM OLEIN | 998.50 | 998.50 998.50 |
0.00 0.00% |
| CRUDE OIL - WTI | 64.97 | 65.82 64.50 |
-0.55 -0.84% |
| SUGAR #11 WORLD | 16.19 | 16.74 16.14 |
-0.52 -3.11% |
Chart of the Day
Latest News
Top 5 things to watch in this week
Pakistan Stock Movers
| Name | Last | Chg/%Chg |
|---|
| Name | Last | Chg/%Chg |
|---|