NBP posts Rs26bn profit, Rs8 dividend

MG News | March 03, 2025 at 09:23 AM GMT+05:00
March 03, 2025 (MLN): The National Bank of Pakistan (PSX: NBP) reported a significant decline in its profit after taxation for the year ended December 31, 2024, posting Rs26 bilion compared to Rs53bn in 2023, reflecting a drop of 50%.
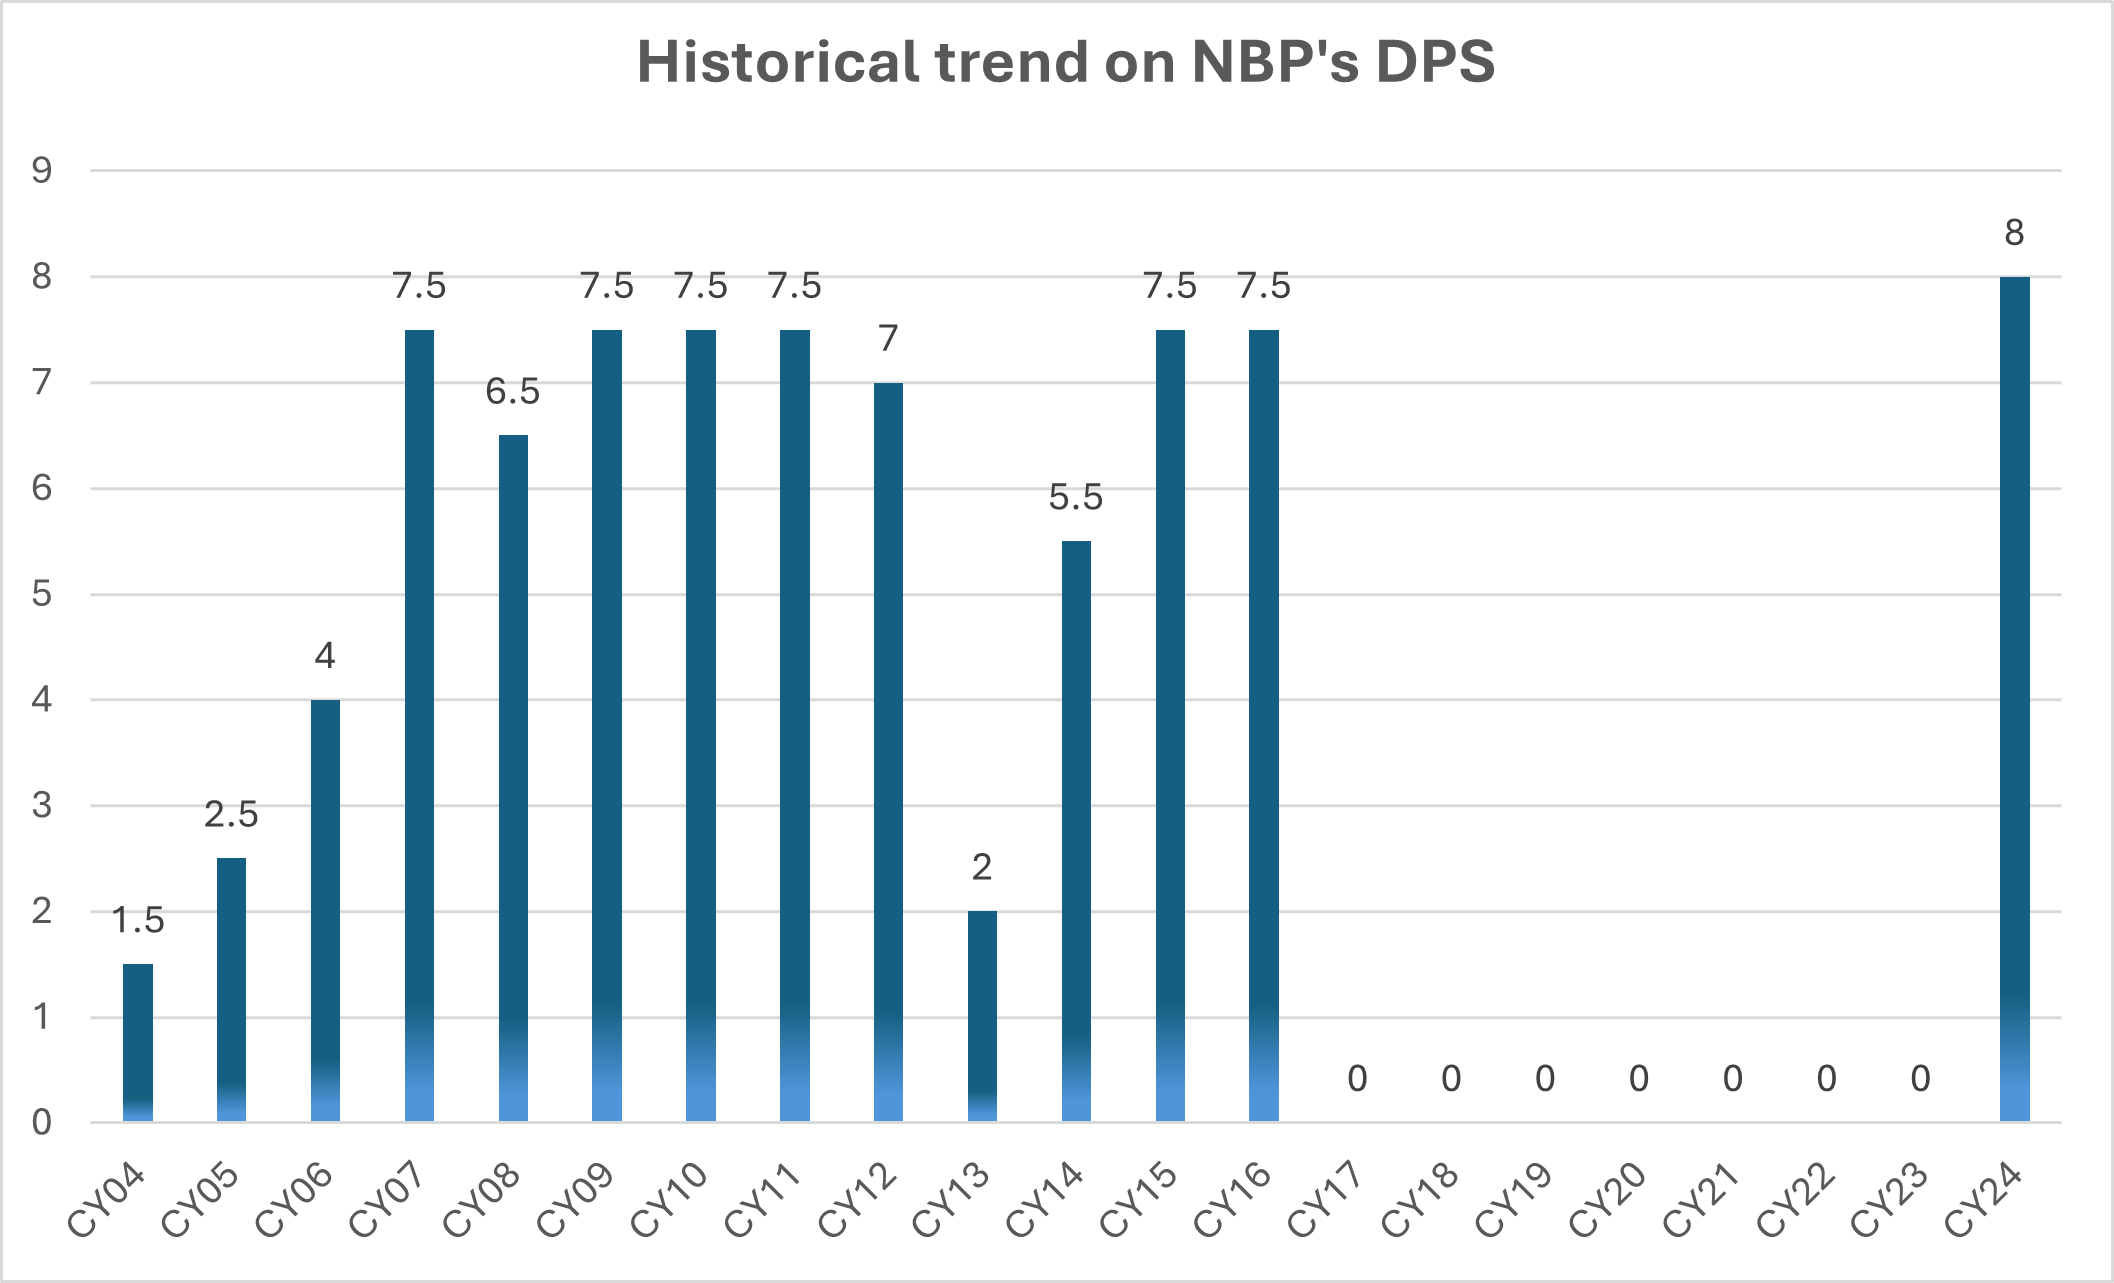
The board of directors has recommended the highest-ever final cash dividend of Rs8 per share (80%) for the year 2024.
The bank’s earnings per share also fell to Rs12.21 from Rs24.96 in the previous year.
NBP’s total income grew 13% to Rs241.7bn in 2024 from Rs214bn in 2023, primarily driven by a 57% increase in non-markup income, which reached Rs70.3bn.
This surge was supported by a 537.7% rise in gains on securities, totaling Rs28bn, along with a 21% increase in fee and commission income, which stood at Rs29bn.
However, foreign exchange income dropped by 23.6% to Rs6bn, and other income fell by 59.6% to Rs725m.
Despite the rise in revenue, the bank faced a substantial increase in expenses.
Operating expenses surged by 89% to Rs180bn from Rs95bn, contributing to an overall 88.7% rise in total non-markup expenses, which stood at Rs180bn.
NBP’s profit before taxation declined by 44.7% to Rs57bn in 2024, while credit loss allowances and provisions decreased by 70.7% to Rs4.5bn, offering some relief.
Tax expenses also dropped by 38.7% to Rs30.6bn.
| Consolidated statement of profit and loss account for the year ended December 31, 2024 (in Rupees ‘000) | 2024 | 2023 | %Change |
| Mark-up / Return / Interest Earned | 1,089,890,938 | 1,025,134,662 | 6.32% |
| Mark-up / Return / Interest Expensed | 918,452,244 | 855,780,390 | 7.32% |
| Net Mark-up / Interest Income | 171,438,694 | 169,354,272 | 1.23% |
| Fee and Commission Income | 29,171,163 | 24,136,296 | 20.86% |
| Dividend Income | 5,898,270 | 5,204,557 | 13.33% |
| Foreign Exchange Income | 5,913,142 | 7,742,186 | -23.62% |
| Gain on Securities | 28,195,070 | 4,421,246 | 537.72% |
| Share of Profit from Joint Venture - Net of Tax | 604,843 | 1,226,065 | -50.67% |
| Share of Profit from Associates - Net of Tax | 478,612 | 245,202 | 95.19% |
| Other Income | 724,806 | 1,796,449 | -59.65% |
| Total Non-Markup / Interest Income | 70,323,420 | 44,772,001 | 57.07% |
| Total Income | 241,762,114 | 214,126,273 | 12.91% |
| Operating Expenses | 180,092,705 | 95,159,211 | 89.25% |
| Other Charges | 46,026 | 285,960 | -83.90% |
| Total Non-Markup / Interest Expenses | 180,138,731 | 95,445,171 | 88.74% |
| Profit Before Credit Loss Allowance / Provisions | 61,623,383 | 118,681,102 | -48.08% |
| Credit Loss Allowance / Provisions and Write Offs - Net | 4,503,223 | 15,382,139 | -70.72% |
| PROFIT BEFORE TAXATION | 57,120,160 | 103,298,963 | -44.70% |
| Taxation | 30,617,455 | 49,977,566 | -38.74% |
| PROFIT AFTER TAXATION | 26,502,705 | 53,321,397 | -50.30% |
| Basic Earnings Per Share | 12.21 | 24.96 |
Copyright Mettis Link News
Related News


| Name | Price/Vol | %Chg/NChg |
|---|---|---|
| KSE100 | 152,213.95 190.21M | 0.16% 240.96 |
| ALLSHR | 91,171.93 331.86M | -0.01% -6.93 |
| KSE30 | 46,619.30 86.78M | 0.63% 292.83 |
| KMI30 | 212,430.71 86.75M | 0.12% 260.53 |
| KMIALLSHR | 58,290.15 175.95M | -0.16% -92.23 |
| BKTi | 44,782.22 24.23M | 1.07% 476.19 |
| OGTi | 29,068.64 8.05M | -0.13% -38.15 |
| Symbol | Bid/Ask | High/Low |
|---|
| Name | Last | High/Low | Chg/%Chg |
|---|---|---|---|
| BITCOIN FUTURES | 66,185.00 | 67,760.00 64,325.00 | -1640.00 -2.42% |
| BRENT CRUDE | 71.88 | 71.96 70.69 | 0.12 0.17% |
| RICHARDS BAY COAL MONTHLY | 96.00 | 0.00 0.00 | -3.50 -3.52% |
| ROTTERDAM COAL MONTHLY | 107.95 | 107.95 107.95 | 0.30 0.28% |
| USD RBD PALM OLEIN | 1,071.50 | 1,071.50 1,071.50 | 0.00 0.00% |
| CRUDE OIL - WTI | 66.60 | 66.67 65.38 | 0.12 0.18% |
| SUGAR #11 WORLD | 14.05 | 14.10 13.78 | 0.18 1.30% |
Chart of the Day
Latest News
Top 5 things to watch in this week
Pakistan Stock Movers
| Name | Last | Chg/%Chg |
|---|
| Name | Last | Chg/%Chg |
|---|