BOP's profit after tax plunges by 21% to Rs5.97bn in 9MCY23

MG News | October 30, 2023 at 10:59 AM GMT+05:00

October 30, 2023 (MLN): The Bank of Punjab (PSX: BOP) announced its results for the nine months of 2023, wherein the bank’s profit after tax went down by 21.29% YoY to Rs5.97 billion [EPS: Rs1.78] compared to Rs7.58bn [EPS: Rs2.29] profit recorded in the same period last year (SPLY).
Going by the income statement made available by the company on the PSX, the bank’s net markup income soared by 22.57% YoY, to clock in at Rs28.13bn against Rs22.95bn incurred in the SPLY.
Similarly, the bank’s total non-markup interest income improved by 36.52% YoY to Rs8.79bn as compared to Rs6.44bn in SPLY.
This was due to an increase in Fee and commission income of 28.17% YoY to Rs6.49bn in 9MCY23.
Moreover, BOP incurred a foreign exchange loss of Rs377.06m, compared to a gain of Rs1.59bn in the SPLY, this further contributed to the decline in the bank’s profitability.
The profit and loss statement further shows that the nine months’ total non-mark-up/interest expenses stood at Rs27.74bn, up by 33.3% YoY.
However, despite the increased flow of income, expenses rose by a greater proportion, resulting in a decline in profit after tax.
During the 9MCY23, the bank incurred a provision reversal of Rs296.22m, compared to a provision expense worth Rs3.85bn reported in the SPLY.
On the taxation front, the bank incurred a tax of Rs2.91bn, 39.93% YoY lower than the tax of Rs4.85bn recorded in SPLY.
| Consolidated Profit and Loss Account for the nine months ended September 2023 (Rupees in '000) | |||
|---|---|---|---|
| Sep 23 | Sep 22 | % Change | |
| Mark-up/return/interest earned | 223,983,989 | 94,618,446 | 136.72% |
| Mark-up/return/interest expensed | 195,849,587 | 71,664,463 | 173.29% |
| Net mark-up/return/interest income | 28,134,402 | 22,953,983 | 22.57% |
| NON MARK-UP/INTEREST INCOME | |||
| Fee and commision income | 6,487,736 | 5,061,681 | 28.17% |
| Dividend income | 336,848 | 389,521 | -13.52% |
| Foreign exchange (loss) income | -377,056 | 1589421 | - |
| Income/(loss) from derivatives | - | - | |
| Gain / (loss) on securities - net | 336,268 | -811,797 | -141.42% |
| Other income-net | 2,003,572 | 207,762 | 864.36% |
| Total non mark-up/interest income | 8,787,368 | 6,436,588 | 36.52% |
| Total Income | 36,921,770 | 29,390,571 | 25.62% |
| NON MARK-UP/INTEREST EXPENSES | |||
| Operating expenses | 27,616,408 | 20,569,116 | 34.26% |
| Workers welfare fund | 119,675 | 210,631 | - |
| Other charges | 8,806 | 34,556 | -74.52% |
| Total non mark-up/interest expenses | 27,744,889 | 20,814,303 | 33.30% |
| Profit before provisions | 9,176,881 | 8,576,268 | 7.00% |
| Provisions and write offs - net | 296,217 | -3,854,897 | -107.68% |
| Extraordinary/unusual items | - | - | - |
| Profit before taxation | 8,880,664 | 12,431,165 | -28.56% |
| Taxation | 2,912,850 | 4,849,096 | -39.93% |
| Profit after taxation | 5,967,814 | 7,582,069 | -21.29% |
| Earnings per share - Basic and Diluted (in Rupees) | 1.78 | 2.29 | - |
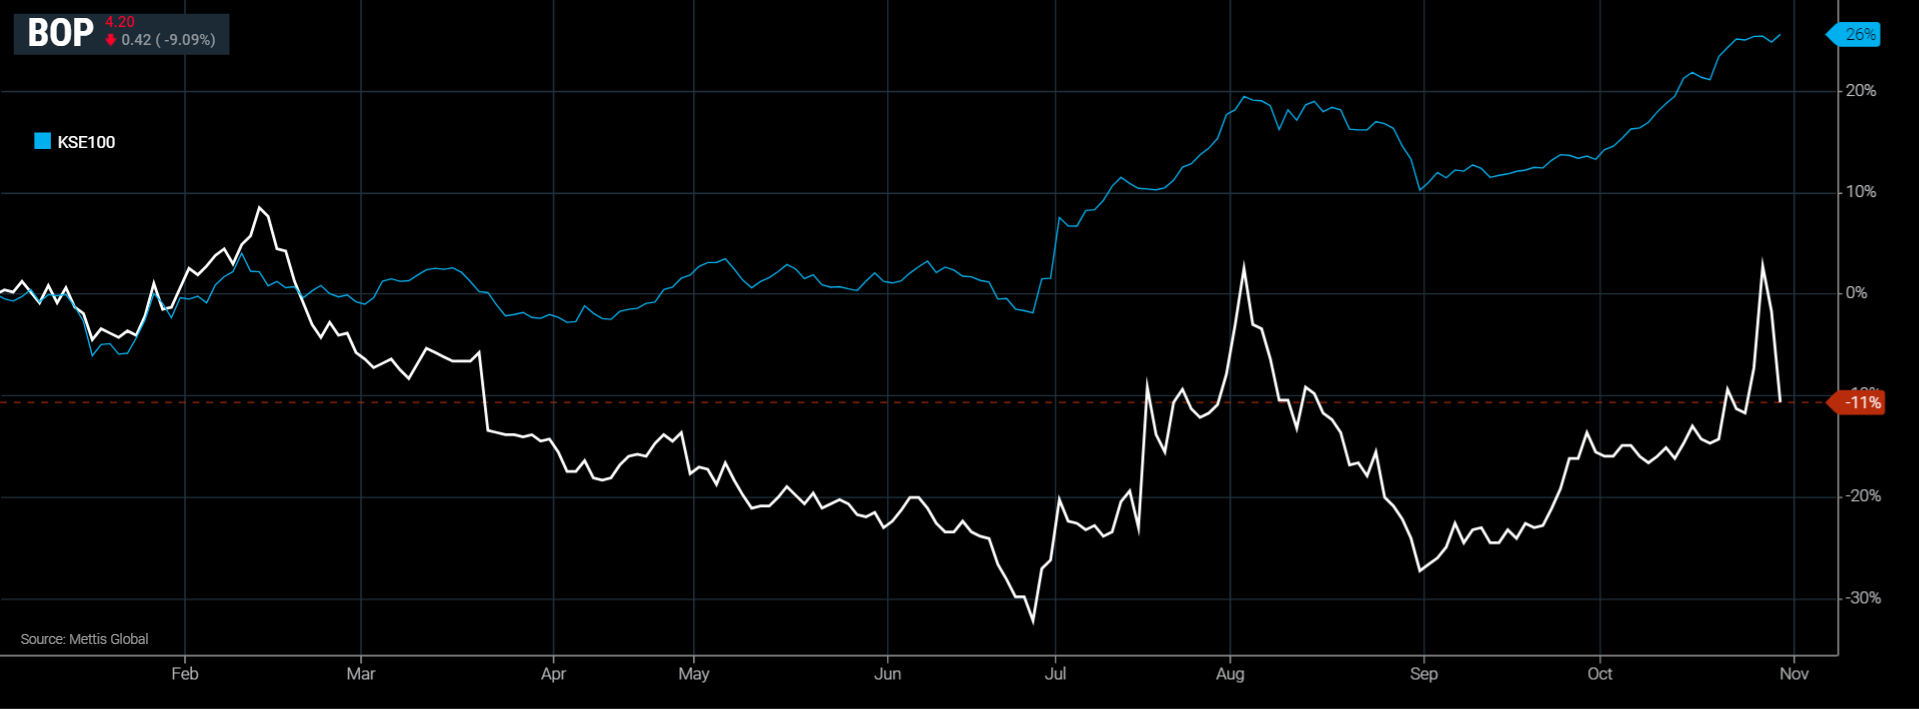
BOP and KSE-100 YTD Performance
Copyright Mettis Link News
Related News
_20260529073616622_a5048c.jpeg?width=280&height=140&format=Webp)


| Name | Price/Vol | %Chg/NChg |
|---|---|---|
| KSE100 | 179,571.27 436.67M | 1.06% 1878.35 |
| ALLSHR | 108,600.94 844.23M | 1.00% 1073.54 |
| KSE30 | 53,548.42 162.02M | 0.99% 525.53 |
| KMI30 | 256,725.70 154.74M | 0.76% 1936.43 |
| KMIALLSHR | 70,620.69 563.61M | 0.98% 683.55 |
| BKTi | 48,625.03 36.31M | 1.37% 658.39 |
| OGTi | 37,179.52 8.29M | 0.94% 345.85 |
| Symbol | Bid/Ask | High/Low |
|---|
| Name | Last | High/Low | Chg/%Chg |
|---|---|---|---|
| BITCOIN FUTURES | 60,085.00 | 60,230.00 59,790.00 | 90.00 0.15% |
| BRENT CRUDE | 73.08 | 75.13 71.38 | -2.18 -2.90% |
| RICHARDS BAY COAL MONTHLY | 115.00 | 0.00 0.00 | 1.65 1.46% |
| ROTTERDAM COAL MONTHLY | 126.25 | 0.00 0.00 | 0.15 0.12% |
| USD RBD PALM OLEIN | 1,135.00 | 1,135.00 1,135.00 | 0.00 0.00% |
| CRUDE OIL - WTI | 70.24 | 71.86 68.56 | -1.68 -2.34% |
| SUGAR #11 WORLD | 14.55 | 14.68 14.02 | 0.45 3.19% |
Chart of the Day
Latest News
Top 5 things to watch in this week
Pakistan Stock Movers
| Name | Last | Chg/%Chg |
|---|
| Name | Last | Chg/%Chg |
|---|