
Pakistan LSMI contracts 5% MoM in August

MG News | October 16, 2026 at 02:33 PM GMT+05:00

October 16, 2026 (MLN): Pakistan’s Large Scale Manufacturing Industries (LSMI) output fell 4.96% month-on-month (MoM) in August 2026, with the Quantum Index of Manufacturing (QIM) at 113.19, down from 119.10 in July.
On a year-on-year (YoY) basis, output rose 0.67%, against 112.45 in August 2025, according to provisional data released by the Pakistan Bureau of Statistics (PBS) with base year 2015-16.
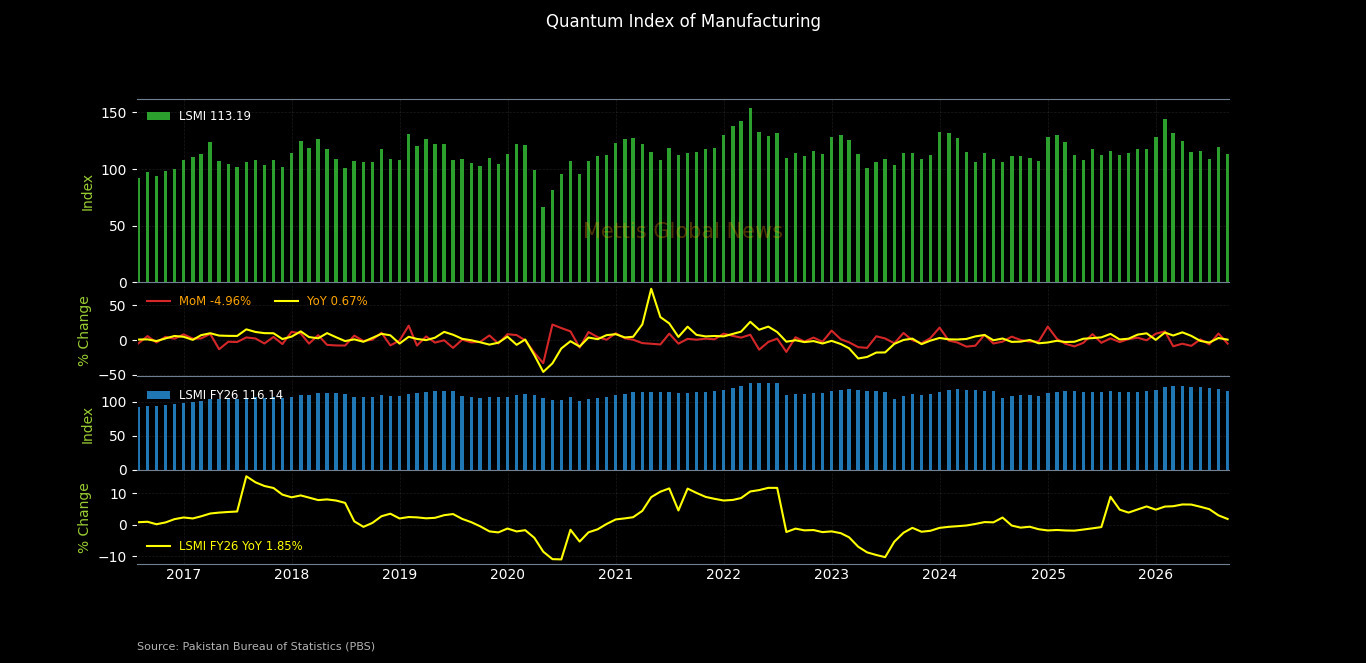
For July-August 2026-27, the first two
months of fiscal year 2026-27, output grew 1.85% YoY, with the QIM at 116.14
against 114.03 in the same period last year.
Garments, petroleum products and
automobiles led the performance, while food, chemicals and pharmaceuticals
weighed on output.
Growth of Major Manufacturing Items
|
Manufacturing Sector |
Weight (%) |
Change Aug-26 (%) |
Change Jul-Aug FY27 (%) |
|
Cotton Yarn |
8.88 |
1.46 |
2.09 |
|
Cotton Cloth |
7.29 |
0.04 |
-0.03 |
|
Garments |
6.08 |
10.85 |
16.69 |
|
Petroleum Products |
6.66 |
31.85 |
15.48 |
|
Fertilizers |
3.93 |
-9.00 |
-7.55 |
|
Cement |
4.65 |
-3.52 |
1.26 |
|
Iron & Steel |
3.45 |
-11.56 |
-11.48 |
|
Automobile |
3.10 |
11.66 |
32.45 |
On a cumulative basis, the automobile sector surged 32.45% YoY, while garments rose 16.69% and petroleum products gained 15.48%.
Cement edged up 1.26% and cotton yarn grew 2.09%, while cotton
cloth slipped marginally by 0.03%. Fertilizers fell 7.55%, and iron and steel
continued its downward trend with a decline of 11.48%.
Among other sectors, other transport equipment grew 37.04% during the two months, tobacco rose 22.35% and furniture increased 31.08%.
Fabricated metal gained 10.31%, computer, electronics and
optical products rose 5.15%, electrical equipment grew 4.99% and rubber
products edged up 2.50%. Wood products jumped 253.26%, albeit on a very small
weight of 0.18%.
On the decline side, food output fell 8.86%, beverages dropped 7.21% and textile slipped 2.98% YoY. Pharmaceuticals fell 14.57%, while chemicals declined 10.78%, with chemical products down 16.83% and fertilizers down 7.55% within that group.
Paper and board fell 5.72%,
machinery and equipment dropped 4.27% and leather products slipped 0.88%. Other
manufacturing (football) posted the sharpest fall at 39.57%.
August 2026 Performance
In August alone, petroleum products
rose 31.85% YoY, while automobiles gained 11.66% and garments grew 10.85%.
Furniture rose 73.47%, other transport equipment grew 26.95% and tobacco gained
10.11%. Cotton yarn grew 1.46%, while cotton cloth was nearly flat at 0.04%.
In contrast, food output fell 10.49%,
beverages dropped 7.79% and textile declined 2.80%. Chemicals fell 12.93%,
pharmaceuticals dropped 8.86%, iron and steel declined 11.56%, fertilizers
slipped 9.00% and cement fell 3.52%. Other manufacturing (football) declined
37.97%.
Sectoral Contributions
The main contributors toward the
overall 1.85% YoY growth during July-August were wearing apparel (2.85
percentage points), automobiles (1.20), petroleum products (1.17), furniture
(0.43), tobacco (0.37), other transport equipment (0.27), electrical equipment
(0.13) and cement (0.07).
Conversely, food (-1.20), chemicals
(-0.89), pharmaceuticals (-0.86), textile (-0.52), iron and steel products
(-0.48), beverages (-0.37) and machinery and equipment (-0.01) weighed on
overall growth.
For August alone, petroleum products
(2.26 percentage points) and wearing apparel (1.79) were the largest
contributors, while food (-1.45) and chemicals (-1.09) were the largest drags.
The mixed sectoral performance
reflects continued strength in garments and automobiles even as food,
chemicals, pharmaceuticals and iron and steel remained under pressure in the
first two months of the fiscal year.
Copyright Mettis Link News
Related News


| Name | Price/Vol | %Chg/NChg |
|---|---|---|
| KSE100 | 166,264.96 85.40M | 0.05% 78.79 |
| ALLSHR | 100,879.52 259.64M | 0.06% 56.24 |
| KSE30 | 49,295.70 35.82M | 0.00% 2.16 |
| KMI30 | 240,324.22 44.41M | 0.13% 302.29 |
| KMIALLSHR | 65,559.08 165.54M | 0.13% 83.32 |
| BKTi | 45,676.61 4.49M | -0.15% -68.21 |
| OGTi | 33,710.57 1.67M | 0.05% 15.85 |
| Symbol | Bid/Ask | High/Low |
|---|
| Name | Last | High/Low | Chg/%Chg |
|---|---|---|---|
| BITCOIN FUTURES | 82,130.00 | 82,685.00 81,700.00 | -300.00 -0.36% |
| BRENT CRUDE | 105.51 | 105.94 104.91 | -0.41 -0.39% |
| RICHARDS BAY COAL MONTHLY | 128.50 | 0.00 0.00 | 0.30 0.23% |
| ROTTERDAM COAL MONTHLY | 145.10 | 0.00 0.00 | 0.15 0.10% |
| USD RBD PALM OLEIN | 1,167.50 | 1,167.50 1,167.50 | 0.00 0.00% |
| CRUDE OIL - WTI | 95.63 | 96.39 95.29 | -0.87 -0.90% |
| SUGAR #11 WORLD | 20.72 | 21.01 20.63 | -0.41 -1.94% |
Chart of the Day
Latest News
Top 5 things to watch in this week
 Foreign Currency Deposits
Pakistan Stock Movers
| Name | Last | Chg/%Chg |
|---|
| Name | Last | Chg/%Chg |
|---|