Gold’s Great Breakout: A Year-End Retrospective on Monetary Policy and Real Assets

MG News | December 31, 2025 at 10:57 AM GMT+05:00

December 31, 2025 (MLN): As 2025 draws to a close,
the financial world is reflecting on a historic year where the tether between
paper currency and tangible value finally snapped.
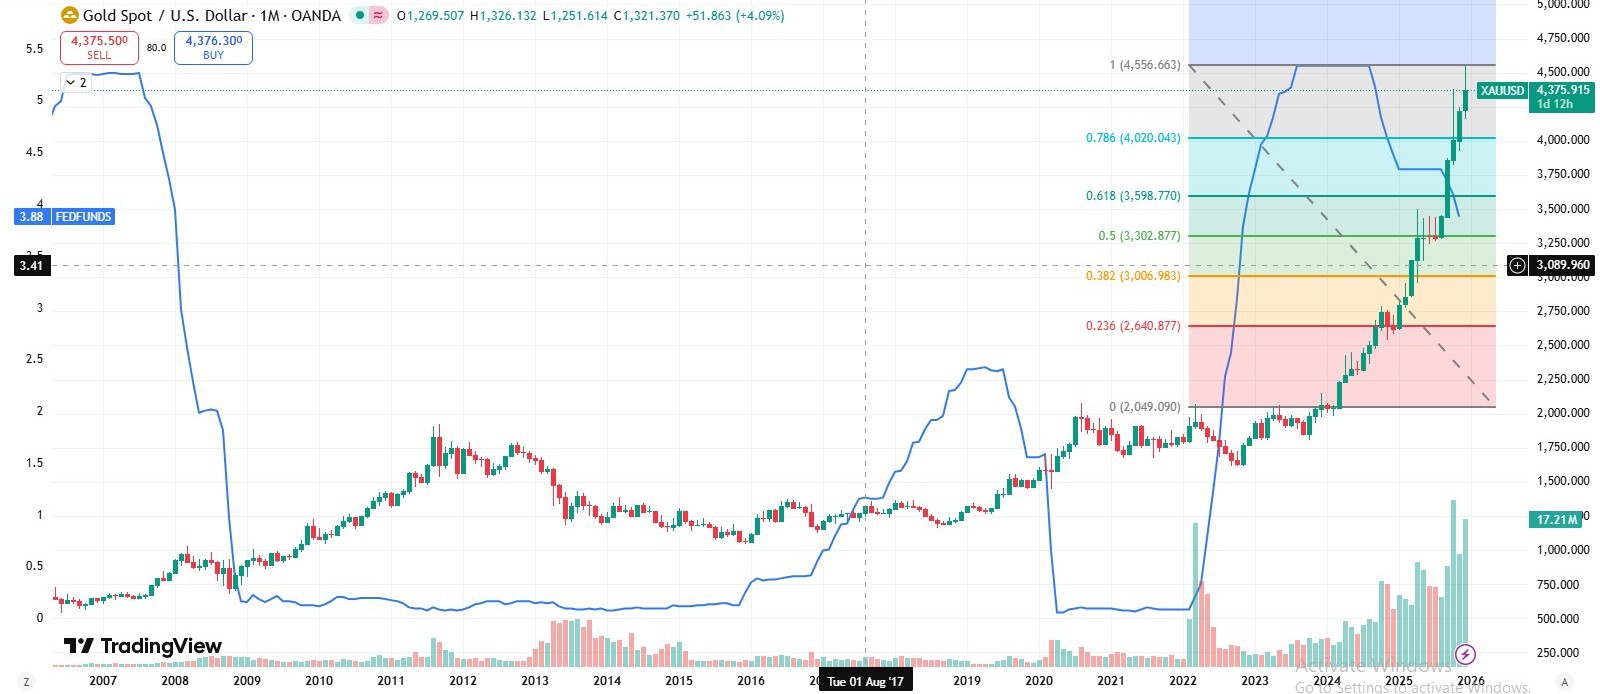
At Mattis Global, our analysis of the Federal Funds Rate
(FFR) versus Gold prices reveals a profound shift in global investor
sentiment—one that validates our core thesis of transitioning from
"Riba" (interest-based debt) to "Bai" (partnership-based
real assets).
The Historical Inverse Correlation
A look at the long-term chart shows that Gold and the FFR
have historically shared a delicate, often inverse, relationship.
The GFC Era: During the Great Financial Crisis, the Fed
slashed rates from 5.25% to near-zero (0.15%) within six months. While markets
panicked, Gold remained a pillar of stability.
The $700 to $2,000 Surge: Between 2009 and 2016, as the Fed
held rates at historic lows to stimulate growth, Gold prices surged,
effectively tripling in value.
The Pandemic Ceiling: During the 2020 COVID-19 crisis, rates
were again dropped to zero. However, Gold struggled to decisively break the
$2,000 psychological barrier, eventually retreating as the Fed initiated a
rapid-fire hiking cycle to combat inflation.
2024-2025: The Year of the Great Decoupling
The real story began in March 2024. As the market shifted
its expectations from "higher for longer" to imminent rate cuts, Gold
finally shattered the $2,100 ceiling. This breakout opened the proverbial
floodgates.
Driven by both FFR cut expectations and actual cuts, Gold
embarked on an aggressive bullish channel, reaching an astonishing peak of
$4,550 per ounce earlier this year. This was not just a price move; it was a
vote of no confidence in the debt-fueled monetary system.
Current Market Pulse: The January 9 Pivot
In recent weeks, Gold has shown negative sensitivity to news
suggesting the Fed may pause further cuts. The market is currently
"hinged" on the direction of the FFR, which remains a tracker for the
broader health of the US economy.
All eyes are now fixed on January 9, 2026, for the release of the Non-Farm Payroll (NFP) data. This report will be the primary catalyst for Gold’s next major move. A weak labor report may force the Fed’s hand toward further cuts, potentially reigniting the rally toward new all-time highs.
Copyright Mettis Link News
Related News


| Name | Price/Vol | %Chg/NChg |
|---|---|---|
| KSE100 | 179,927.05 365.01M | -1.27% -2314.73 |
| ALLSHR | 109,270.69 838.76M | -1.19% -1312.98 |
| KSE30 | 53,705.71 89.34M | -1.33% -726.00 |
| KMI30 | 253,531.92 109.38M | -1.32% -3382.29 |
| KMIALLSHR | 70,152.63 543.97M | -1.25% -888.68 |
| BKTi | 50,997.50 18.73M | -1.38% -715.26 |
| OGTi | 36,216.08 8.18M | -1.21% -443.50 |
| Symbol | Bid/Ask | High/Low |
|---|
| Name | Last | High/Low | Chg/%Chg |
|---|---|---|---|
| BITCOIN FUTURES | 63,050.00 | 64,680.00 62,605.00 | -1035.00 -1.62% |
| BRENT CRUDE | 78.49 | 79.80 77.28 | 2.48 3.26% |
| RICHARDS BAY COAL MONTHLY | 105.75 | 0.00 0.00 | -1.15 -1.08% |
| ROTTERDAM COAL MONTHLY | 118.00 | 0.00 0.00 | 0.65 0.55% |
| USD RBD PALM OLEIN | 1,135.00 | 1,135.00 1,135.00 | 0.00 0.00% |
| CRUDE OIL - WTI | 73.76 | 75.08 72.61 | 2.35 3.29% |
| SUGAR #11 WORLD | 14.88 | 14.98 14.65 | 0.00 0.00% |
Chart of the Day
Latest News
Top 5 things to watch in this week
Pakistan Stock Movers
| Name | Last | Chg/%Chg |
|---|
| Name | Last | Chg/%Chg |
|---|