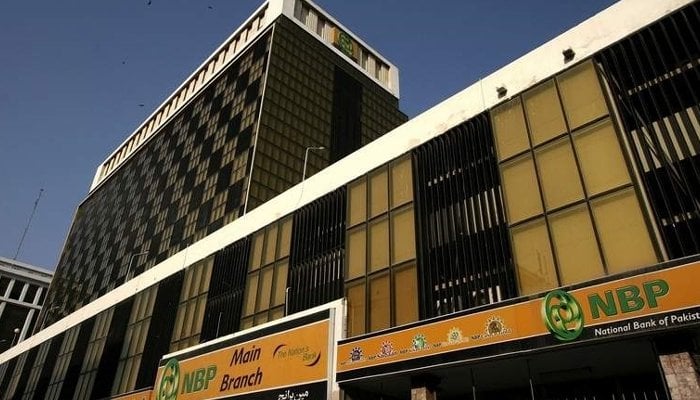
National Bank of Pakistan profit plunges 75%

By MG News | October 30, 2024 at 10:07 AM GMT+05:00
October 30, 2024 (MLN): The National Bank of Pakistan (PSX: NBP) reported a significant decline in its financial performance for the third quarter, with net profit dropping by over 75% to Rs3.09 billion [EPS: Rs1.39], compared to Rs12.38bn [EPS: Rs5.78] in the same period last year (SPLY).
The primary reason for the decline in the National Bank's profit was a substantial 29.44% drop in net interest income.
Conversely, the bank’s total non-markup income improved by 94.75% YoY to Rs13.18bn, owing to a rise in securities gains and fee and commission income.
Nonetheless, total income decreased by 13.97%, driven by a nearly Rs14 billion drop in interest income.
On the expense side, the NBP’s total non-markup expenses increased by 34.94% to Rs29.36bn in Q3 CY24.
NBP's provision expense decreased by 68.48%, falling to Rs2.91 billion from Rs9.24 billion recorded in Q3 CY23.
During the period, the bank paid Rs11.38bn in terms of taxation.
| Consolidated financial results for the quarter ended September 30, 2024 ('000 Rupees) | |||
|---|---|---|---|
| Sep-24 | Sep-23 | % Change | |
| Mark-up/return/interest earned | 271,194,298 | 296,473,613 | -8.53% |
| Mark-up/return/interest expensed | 237,638,740 | 248,919,353 | -4.53% |
| Net mark-up/interest income | 33,555,558 | 47,554,260 | -29.44% |
| NON MARK-UP/INTEREST INCOME | |||
| Fee and commission income | 5,991,917 | 4,990,748 | 20.06% |
| Dividend income | 1,088,800 | 1,041,994 | 4.49% |
| Foreign Exchange income | 1,219,014 | -1,695,417 | -171.90% |
| Gain on securities - net | 4,670,055 | 1,506,798 | 209.93% |
| Share of (loss)/profit from joint venture - net of tax | - | 306,638 | - |
| Share of(loss)/profit from associates - net of tax | 25,649 | 60,507 | -57.61% |
| Other income | 183,506 | 555,776 | -66.98% |
| Total non mark-up/interest income | 13,178,941 | 6,767,044 | 94.75% |
| Total Income | 46,734,499 | 54,321,304 | -13.97% |
| NON MARK-UP/INTEREST EXPENSES | |||
| Operating expenses | 29,335,404 | 21,744,613 | 34.91% |
| Other charges | 19,749 | 9,051 | 118.20% |
| Total non mark-up/interest expenses | 29,355,153 | 21,753,664 | 34.94% |
| Profit before provisions | 17,379,346 | 32,567,640 | -46.64% |
| Credit loss allowance and write offs - ne | (2,912,099) | (9,237,614) | -68.48% |
| Extra ordinary / unusual items | - | ||
| Profit before taxation | 14,467,247 | 23,330,026 | -37.99% |
| Taxation | (11,375,897) | (10,950,997) | 3.88% |
| Profit after taxation | 3,091,350 | 12,379,029 | -75.03% |
| Basic and diluted earnings per share | 1.39 | 5.78 | - |
Copyright Mettis Link News
Related News
| Name | Price/Vol | %Chg/NChg |
|---|---|---|
| KSE100 | 132,575.18 116.89M |
-0.62% -828.01 |
| ALLSHR | 82,969.82 660.19M |
-0.26% -218.24 |
| KSE30 | 40,344.61 41.85M |
-0.75% -306.85 |
| KMI30 | 190,720.07 48.82M |
-0.71% -1363.85 |
| KMIALLSHR | 55,707.70 334.60M |
-0.25% -139.99 |
| BKTi | 36,175.97 7.50M |
-0.68% -246.91 |
| OGTi | 28,276.90 7.89M |
-0.57% -160.71 |
| Symbol | Bid/Ask | High/Low |
|---|
| Name | Last | High/Low | Chg/%Chg |
|---|---|---|---|
| BITCOIN FUTURES | 109,130.00 | 109,545.00 108,625.00 |
-85.00 -0.08% |
| BRENT CRUDE | 70.62 | 70.65 69.85 |
0.47 0.67% |
| RICHARDS BAY COAL MONTHLY | 97.50 | 0.00 0.00 |
2.05 2.15% |
| ROTTERDAM COAL MONTHLY | 106.65 | 106.65 106.25 |
0.50 0.47% |
| USD RBD PALM OLEIN | 998.50 | 998.50 998.50 |
0.00 0.00% |
| CRUDE OIL - WTI | 68.82 | 68.87 67.78 |
0.49 0.72% |
| SUGAR #11 WORLD | 16.19 | 16.26 16.08 |
0.06 0.37% |
Chart of the Day
Latest News
Top 5 things to watch in this week
Pakistan Stock Movers
| Name | Last | Chg/%Chg |
|---|
| Name | Last | Chg/%Chg |
|---|


.png)
 Worker Remittances