GSK Pakistan suffers Rs1.23 loss per share in 9 months
.png?width=950&height=450&format=Webp)
MG News | October 24, 2023 at 03:18 PM GMT+05:00

October 24, 2023 (MLN): GlaxoSmithKline (Pakistan) Limited (PSX: GLAXO) unveiled its profit and loss statement for the nine months ended September 30 2023, wherein the loss after tax clocked in at 391.62 million [LPS: Rs1.23], compared to a profit of Rs779.88m [EPS: Rs2.45] in the same period last year (SPLY).
Going by the results, the company's top line marked an increase of 23.05% YoY to Rs37.03bn as compared to Rs30.09bn in SPLY.
However, the cost of sales also rose by 39.97% YoY, which worsened the gross profit by 52.41% YoY to Rs2.62bn in 9MCY23.
During the review period, other income increased by 67.96% YoY to stand at Rs2.96bn in 9MCY23 as compared to Rs1.77bn in SPLY.
On the expense side, the company observed an increase in sales and distribution expenses by 38.00% YoY while reducing other operating expenses by 87.23% YoY to clock in at Rs3.44bn and Rs26.74m respectively during the review period.
The company’s finance charges decreased by 52.21% YoY and stood at Rs377.94m as compared to Rs790.87m in 9MCY22.
On the tax front, the company paid a higher tax worth Rs647.1m against the Rs1.7bn paid in the corresponding period of last year, depicting a rise of 62.04% YoY.
| Unconsolidated (un-audited) Financial Results for Nine months ended 30 September, 2023 (Rupees in '000) | |||
|---|---|---|---|
| Sep 23 | Sep 22 | % Change | |
| Sales | 37,029,870 | 30,094,003 | 23.05% |
| Cost of sales | (34,406,705) | (24,581,431) | 39.97% |
| Gross Profit | 2,623,165 | 5,512,572 | -52.41% |
| Sales and distribution expenses | (3,436,017) | (2,489,953) | 38.00% |
| Administrative expenses | (1,491,802) | (1,302,779) | 14.51% |
| Other Income | 2,964,813 | 1,765,202 | 67.96% |
| Other operating expenses | (26,744) | (209,463) | -87.23% |
| Finance cost | (377,935) | (790,871) | -52.21% |
| Profit before taxation | 255,480 | 2,484,708 | -89.72% |
| Taxation | (647,101) | (1,704,832) | -62.04% |
| Net profit for the period | (391,621) | 779,876 | - |
| Basic earnings/ (loss) per share | (1.23) | 2.45 | - |
Amount in thousand except for EPS
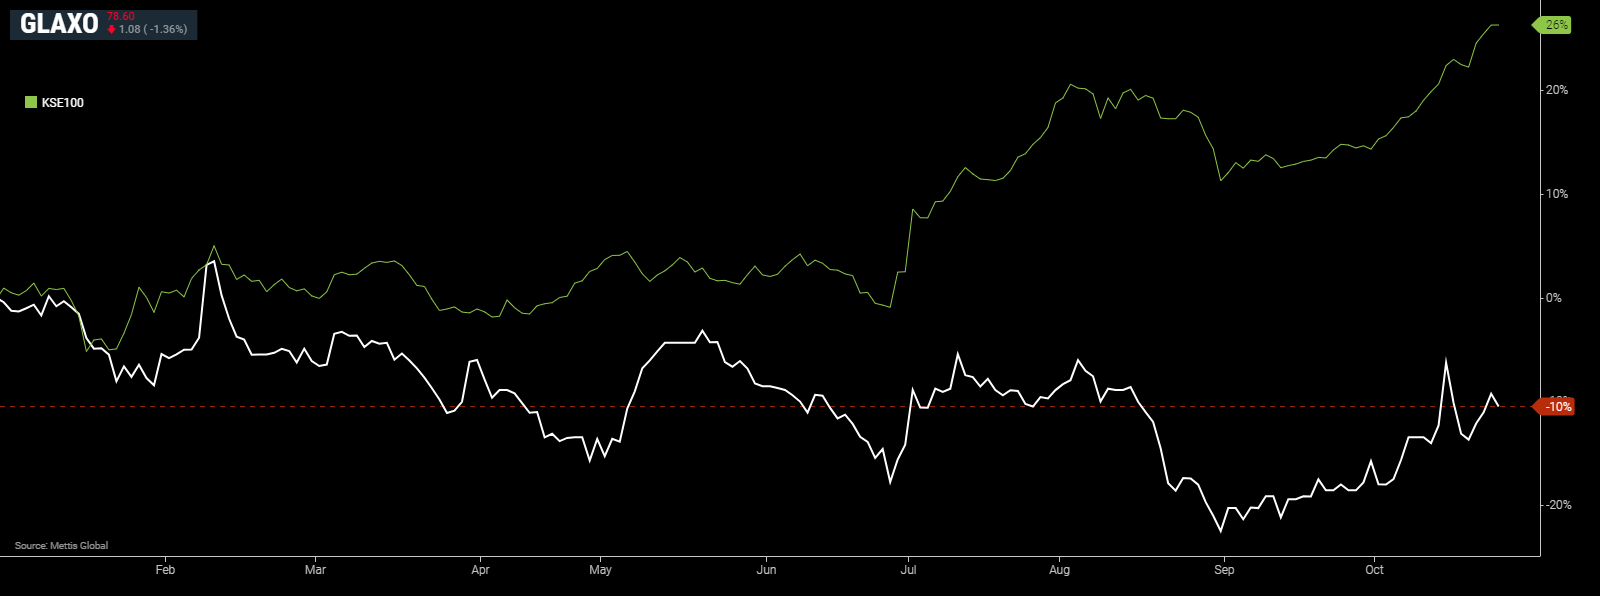
GLAXO and KSE-100 YTD Performance
Copyright Mettis Link News
Related News

.png?width=280&height=140&format=Webp)

| Name | Price/Vol | %Chg/NChg |
|---|---|---|
| KSE100 | 176,094.12 210.43M | 0.31% 546.13 |
| ALLSHR | 106,530.89 879.03M | 0.30% 313.70 |
| KSE30 | 52,480.22 54.21M | 0.01% 4.71 |
| KMI30 | 247,198.06 71.10M | 0.26% 628.83 |
| KMIALLSHR | 68,178.54 320.54M | 0.35% 237.08 |
| BKTi | 50,319.17 20.32M | -0.21% -103.75 |
| OGTi | 34,316.47 3.14M | 0.13% 43.33 |
| Symbol | Bid/Ask | High/Low |
|---|
| Name | Last | High/Low | Chg/%Chg |
|---|---|---|---|
| BITCOIN FUTURES | 63,055.00 | 0.00 0.00 | -75.00 -0.12% |
| BRENT CRUDE | 91.19 | 91.36 84.62 | 4.31 4.96% |
| RICHARDS BAY COAL MONTHLY | 105.75 | 0.00 0.00 | -0.25 -0.24% |
| ROTTERDAM COAL MONTHLY | 119.90 | 0.00 0.00 | -0.35 -0.29% |
| USD RBD PALM OLEIN | 1,175.00 | 1,175.00 1,175.00 | 0.00 0.00% |
| CRUDE OIL - WTI | 86.80 | 86.87 81.06 | 3.21 3.84% |
| SUGAR #11 WORLD | 14.65 | 14.78 14.38 | 0.22 1.52% |
Chart of the Day
Latest News
Top 5 things to watch in this week
Pakistan Stock Movers
| Name | Last | Chg/%Chg |
|---|
| Name | Last | Chg/%Chg |
|---|