Weekly Market Roundup
_20260329054425404_1fb42f.jpeg?width=950&height=450&format=Webp)
MG News | March 29, 2026 at 10:48 AM GMT+05:00

March 29, 2026 (MLN): Pakistan’s equity market
remained under pressure during the outgoing week, as the benchmark KSE-100
Index closed at 151,707.52, compared to 152,740.38 recorded on March 20, 2026.
The index shed 1,032.86 points over the week, translating
into a decline of 0.68% week-on-week (WoW).
Investor sentiment remained weak amid rising geopolitical
uncertainty, particularly escalating tensions between Iran and the United
States, which fueled fears of prolonged conflict and disruption in global
energy markets.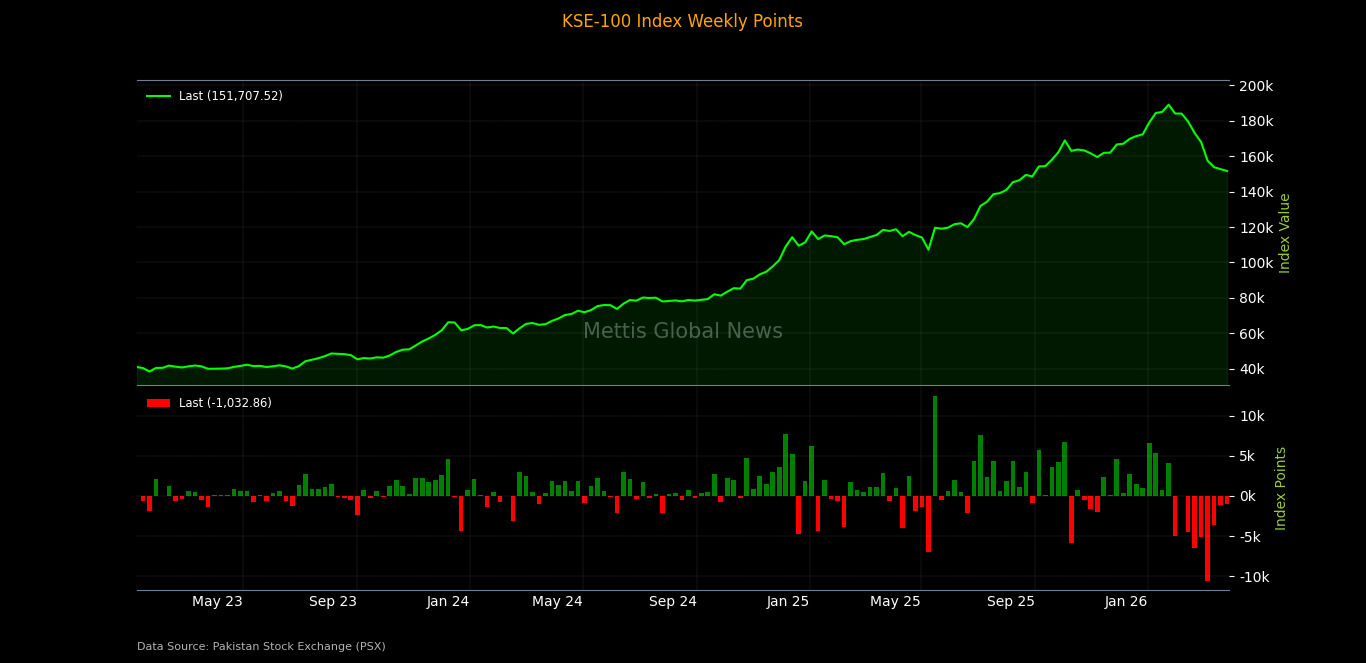
Market Capitalization
Market capitalization also declined in line with the
benchmark index. The total listed market cap fell to Rs4.40 trillion on March
27, 2026, compared to Rs4.43tr recorded on March 20, 2026, marking a
contraction of Rs27.94bn or 0.63% WoW.
In dollar terms, total market capitalization declined by
$95.57m, reaching $15.77bn compared to $15.87bn in the previous week._20260329054416446_515edc.jpeg)
Meanwhile, dollar-adjusted returns stood at negative 0.65%,
compared to negative 0.71% in the prior week, indicating a slight improvement
in the pace of decline on a dollar-adjusted basis.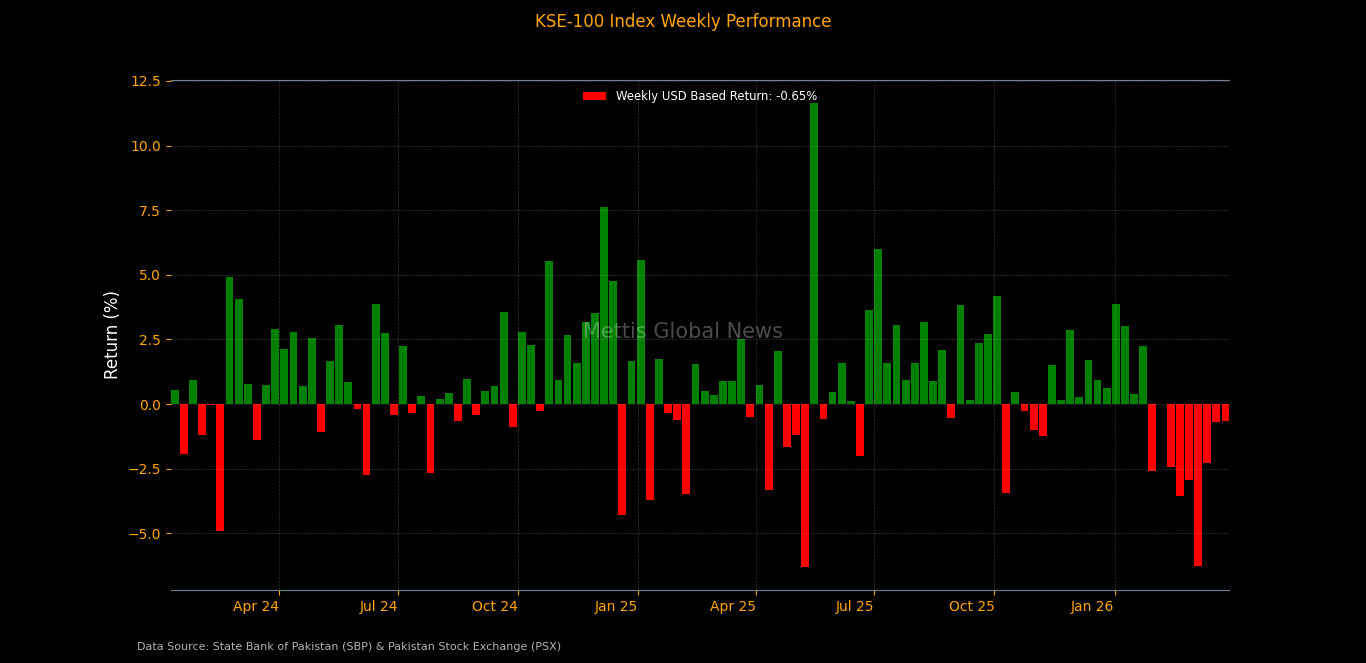
On the macroeconomic front, Pakistan’s money supply rose
to Rs46.67tr in February 2026, reflecting a 1.04% MoM increase and a strong
15.03% YoY growth, according to the State Bank of Pakistan.
The expansion was driven by higher currency in circulation
and deposits, highlighting increased cash usage amid persistent inflationary
pressures.
The State Bank of Pakistan raised
Rs466.23bn through its latest PIB auction, with strong demand led by the
15-year tenor at a cut-off yield of 12.40%.
The central bank rejected all bids for the 10-year tenor,
while most funds were mobilized through competitive bids across medium- and
long-term maturities.
Foreign
exchange reserves held by the State Bank of Pakistan rose by $31.8m WoW to
$21.74bn as of March 19, 2026, led by a $22.1m increase in SBP holdings.
Index Movers
Sector-wise performance presented a mixed trend, with gains
in selective segments offset by heavy losses in key index-heavy sectors.
Technology & communication emerged as the top positive
contributor, adding 391.11 points, followed by investment banks and securities
companies (326.58 points) and fertilizer (93.83 points). Cement (58.89 points),
chemical (32.13 points), paper and packaging (25.03 points), and transport
(19.11 points) also lent support to the index.
On the downside, commercial banks remained the largest drag
on the benchmark, wiping out 805.03 points, followed by oil and gas exploration
companies (-495.51 points) and automobile assemblers (-172.12 points).
Oil and gas marketing companies (-134.83 points),
pharmaceuticals (-77.32 points), food and personal care (-64.38 points), and
miscellaneous (-45.32 points) also contributed to the decline, reflecting
broad-based selling pressure across multiple sectors.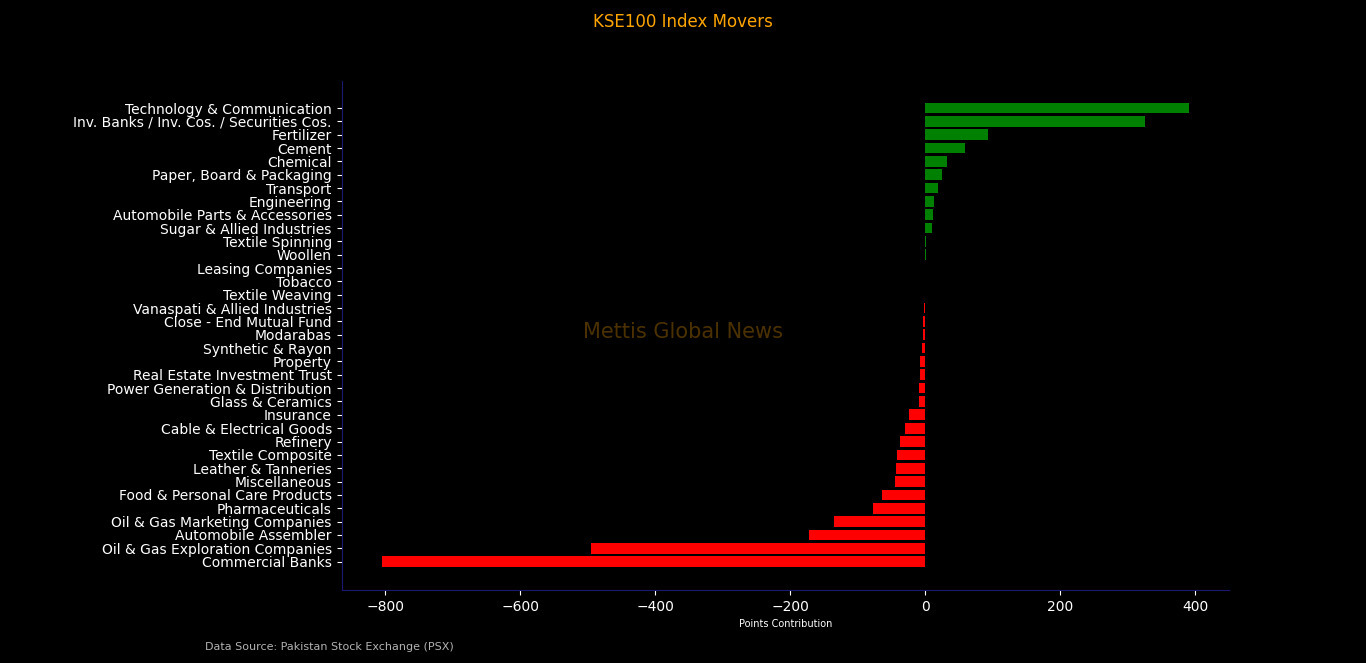
At the company level, select stocks provided notable support
to the index.
Among the gainers, SYS led the chart, adding 422.35 points,
followed by ENGROH (332.20 points) and MEBL (318.53 points). Other key
contributors included FFC (131.92 points), LUCK (112.88 points), HUBC (59.03
points), and BAHL (40.73 points). Additional support came from FCCL, FATIMA,
PKGS, and LCI.
Despite these gains, the benchmark remained under pressure
due to heavy losses in several large-cap stocks.
UBL emerged as the largest drag on the index, wiping out
732.83 points, followed by OGDC (-244.27 points), NBP (-224.17 points), and PPL
(-211.00 points).
Other major laggards included HBL (-106.32 points), PSO
(-91.79 points), EFERT (-66.85 points), and KEL (-65.64 points). Further
pressure came from MLCF, POL, KOHC, BAFL, and AKBL, highlighting continued
selling in index-heavy sectors.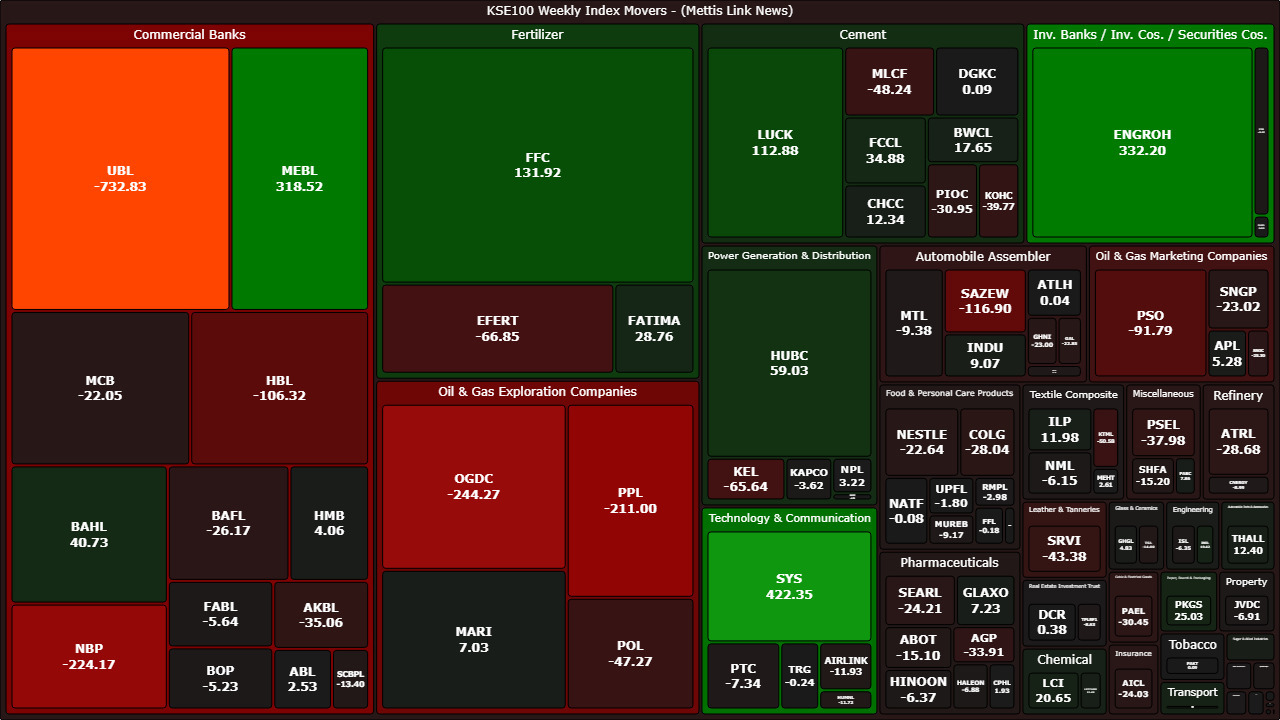
FIPI / LIPI
Foreign investment flows continued to weigh on the market
during the week.
Under Foreign Portfolio Investment (FIPI), foreign investors
remained net sellers with an outflow of $5.32m.
The majority of the selling came from foreign corporates,
which offloaded $9.55m worth of equities. Meanwhile, overseas Pakistanis
provided strong buying support of $4.20m, while foreign individuals remained
largely neutral.
On the other hand, local investors absorbed the foreign
outflow, resulting in a matching net inflow of $5.32m under Local Portfolio
Investment (LIPI).
Among local participants, individuals emerged as the largest
buyers with net purchases of $19.56m, followed by mutual funds ($3.53m) and
broker proprietary trading desks ($2.33m).
On the flip side, insurance companies recorded the largest
selling with an outflow of $12.54m, followed by banks and DFIs (-$6.78m) and
companies (-$1.32m), while NBFCs also remained net sellers._20260329054354568_180993.jpeg)
Copyright Mettis Link News
Related News

_20260529073616622_a5048c.jpeg?width=280&height=140&format=Webp)
_20260711124603464_8ff65f.jpeg?width=280&height=140&format=Webp)
| Name | Price/Vol | %Chg/NChg |
|---|---|---|
| KSE100 | 179,927.05 365.01M | -1.27% -2314.73 |
| ALLSHR | 109,270.69 838.76M | -1.19% -1312.98 |
| KSE30 | 53,705.71 89.34M | -1.33% -726.00 |
| KMI30 | 253,531.92 109.38M | -1.32% -3382.29 |
| KMIALLSHR | 70,152.63 543.97M | -1.25% -888.68 |
| BKTi | 50,997.50 18.73M | -1.38% -715.26 |
| OGTi | 36,216.08 8.18M | -1.21% -443.50 |
| Symbol | Bid/Ask | High/Low |
|---|
| Name | Last | High/Low | Chg/%Chg |
|---|---|---|---|
| BITCOIN FUTURES | 63,155.00 | 64,680.00 62,605.00 | -930.00 -1.45% |
| BRENT CRUDE | 78.40 | 79.80 77.28 | 2.39 3.14% |
| RICHARDS BAY COAL MONTHLY | 105.75 | 0.00 0.00 | -1.15 -1.08% |
| ROTTERDAM COAL MONTHLY | 118.00 | 0.00 0.00 | 0.65 0.55% |
| USD RBD PALM OLEIN | 1,135.00 | 1,135.00 1,135.00 | 0.00 0.00% |
| CRUDE OIL - WTI | 73.70 | 75.08 72.61 | 2.29 3.21% |
| SUGAR #11 WORLD | 14.71 | 14.98 14.65 | -0.17 -1.14% |
Chart of the Day
Latest News
Top 5 things to watch in this week
Pakistan Stock Movers
| Name | Last | Chg/%Chg |
|---|
| Name | Last | Chg/%Chg |
|---|