
PSX in October
MG News | November 02, 2026 at 12:27 PM GMT+05:00

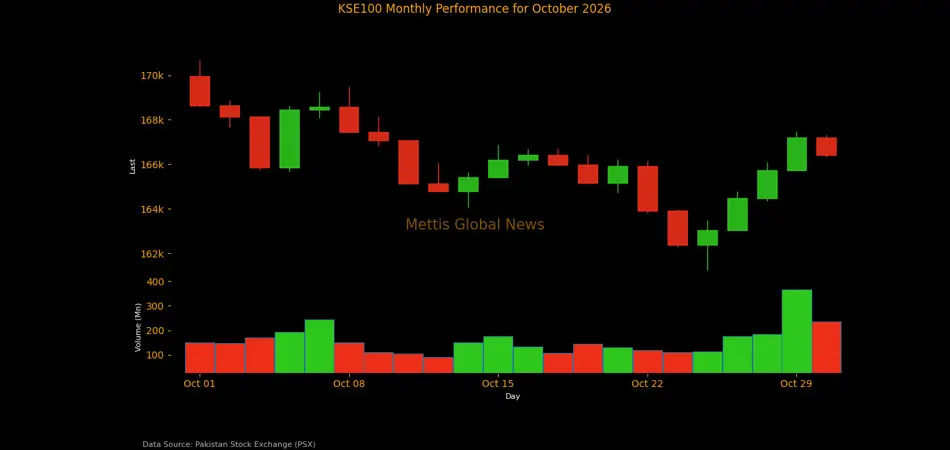
November 2, 2026 (MLN): The KSE-100 Index closed October 2026 on a weak note, as an escalating conflict in the Middle East kept global energy prices elevated, revived inflation worries at home and ultimately pushed the State Bank of Pakistan into tightening monetary policy in the final week of the month.
Even a staff-level agreement with the IMF early in October could not lift the mood for long.
The benchmark index opened the month around
the 169,969 mark, its September 2026 close, and drifted lower for most of the
four weeks, logging five consecutive weekly losses before a late-month bounce.
That recovery proved too shallow, and the index settled at 166,409.25 points,
shedding 3,560.08 points, or 2.09%, on a month-on-month basis.
October was the market’s third losing month out of four so far in FY27. July fell 2.33%, August managed a marginal 0.50% gain, September dropped 3.96%, and October has now taken the fiscal-year-to-date loss to 13,892.45 points, or 7.71%, from the June 2026 close of 180,301.70.
It was also the second October in a row to end in the red,
after a 2.33% fall in October 2025. On a month-end basis, the index now sits
9.65% below its January 2026 peak of 184,174.49 points.
On a year-on-year basis, the picture is still
positive but far less spectacular than last year’s run. Compared with
161,631.73 points at end-October 2025, the index is up 4,777.52 points, or
2.96%, a modest return set against the 43.52% gain the KSE-100 delivered over
FY26 as a whole.
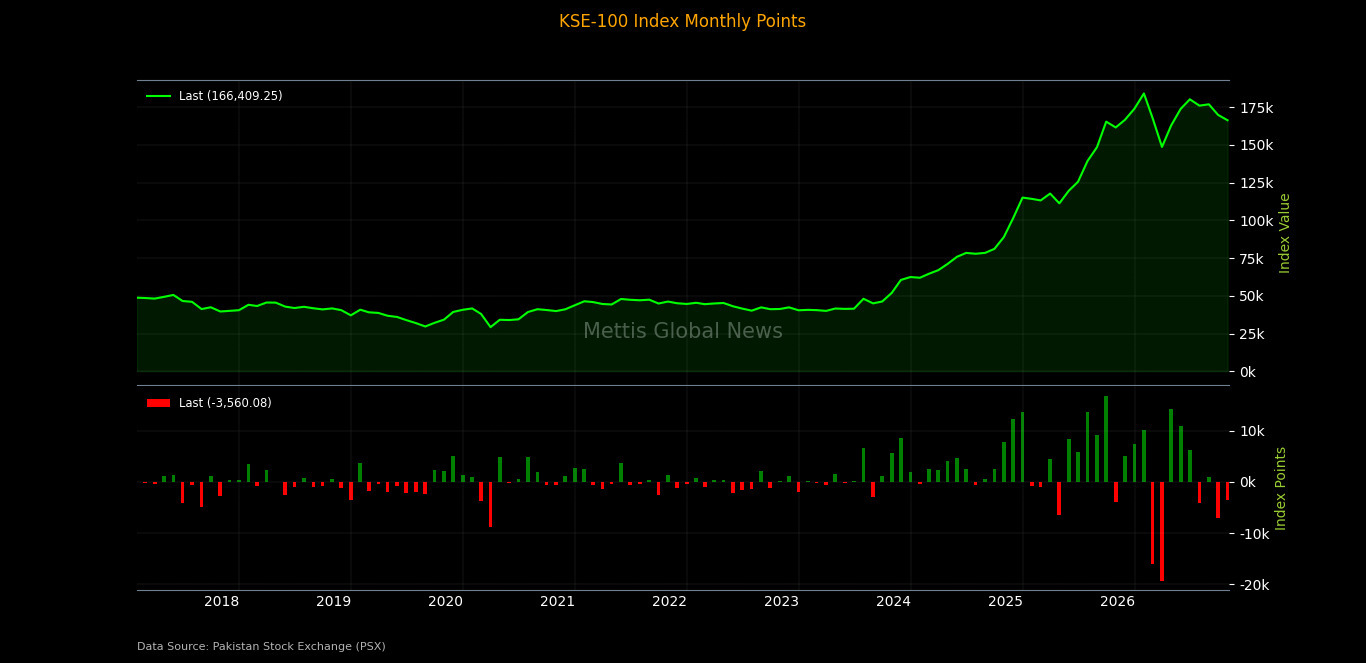
October 2026 extended a difficult start to FY27 for the KSE-100. The index has posted losses in three of the four months so far. July fell 2.33%, August’s 0.50% gain offered only brief relief, September dropped 3.96%, and October shed a further 2.09%. That leaves the cumulative FY27 return at negative 7.71%. It is the weakest first four months of any fiscal year since FY18, when the index lost close to 15% between July and October.
The setback is all the more visible against what came before. The bottom rows of the heatmap reflect three consecutive years of exceptional returns: 89.24% in FY24, 60.15% in FY25 and 43.52% in FY26. Even FY26 was not a smooth ride, with sharp corrections of 8.75% in February and 11.50% in March. The index recovered strongly from those losses before the new fiscal year turned red.
October has historically been a kind month for Pakistani equities. Of the 15 Octobers on the chart since FY13, ten have ended in the green, led by a 12.30% surge in October 2023 (FY24) and a 9.68% rise in October 2024 (FY25). This year’s 2.09% fall, however, follows a 2.33% decline in October 2025. That makes it the first time since FY17 and FY18 that the index has closed consecutive Octobers in negative territory. The worst October on record in the chart remains FY18’s 6.58% slide.
Market Capitalisation
The KSE-100’s market capitalisation contracted
in tandem with the index, falling to Rs4.66 trillion at end-October from Rs4.78
trillion a month earlier. That is an erosion of Rs119.96 billion, or 2.51%,
slightly steeper than the 2.09% decline in the index itself.
The year-on-year comparison is more striking.
Market capitalisation is down Rs112.07 billion, or 2.35%, from Rs4.77 trillion
in October 2025, even though the index itself is nearly 3% higher over the same
period.
In US dollar terms, the KSE-100’s market
capitalisation slipped to $16.84 billion from $17.25 billion in September, a
loss of $410.88 million, or 2.38%. The dollar decline was a touch smaller than
the rupee decline because the rupee firmed slightly during the month, with the
interbank rate easing 0.13% from Rs277.11 to Rs276.75 per dollar.
Year on year, dollar-denominated market
capitalisation is down $149.59 million, or 0.88%, from $16.99 billion in
October 2025. The currency did most of the cushioning: the dollar weakened 1.48% against the rupee over twelve months, from Rs280.91 to Rs276.75,
narrowing a 2.35% rupee-terms contraction to less than 1% in dollar terms.
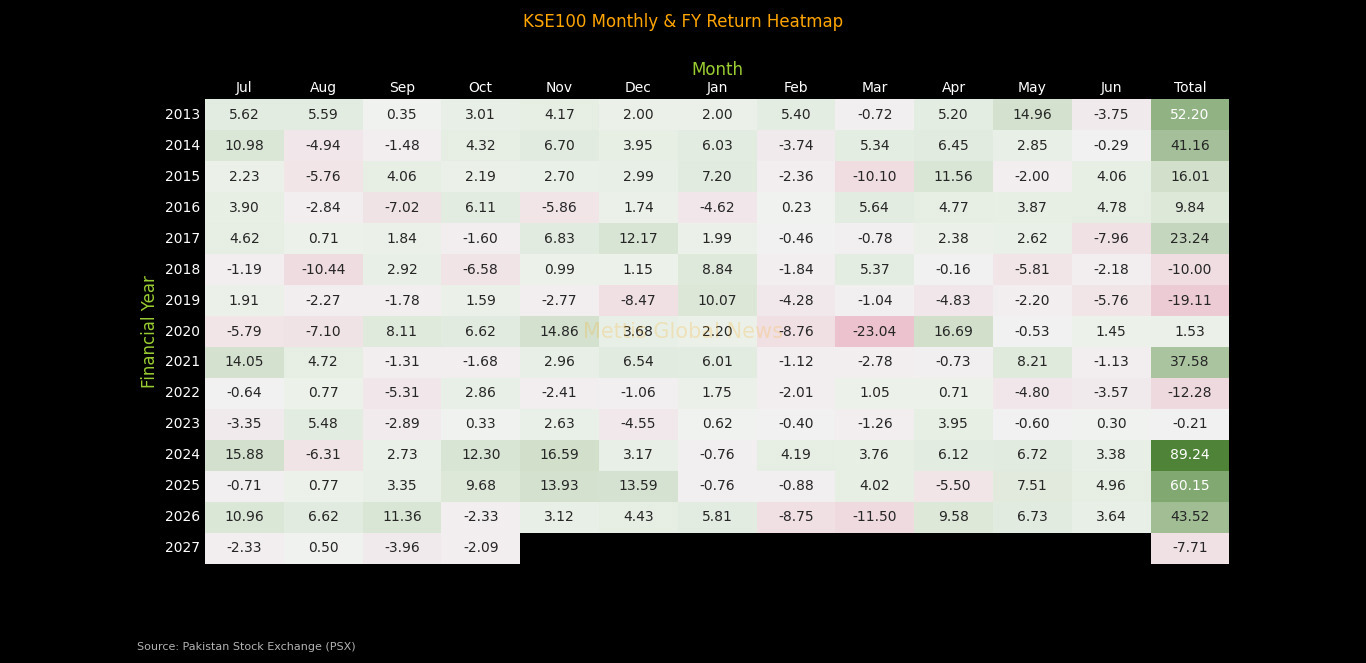
The KSE-100 returned negative 1.97% in US dollar terms during the month, against negative 2.09% in rupee terms, as the stronger rupee clawed back about 13 basis points of the loss. The fiscal-year-to-date dollar return now stands at negative 7.24%, compared with negative 7.71% in local currency.
_20261102063445641_8f754f.jpeg)
The index has delivered a 4.50% return in US dollar terms since end-October 2025, ahead of the 2.96% rupee return, owing to the rupee’s gradual appreciation over the year. That stability remains one of the market’s more underappreciated selling points for foreign money, even as foreign corporates continued to head for the exit in October.
Economic
Backdrop
The month began on an encouraging footing. On
October 7, Pakistan and the IMF reached a staff-level agreement on the fourth
review of the Extended Fund Facility and the third review of the Resilience and
Sustainability Facility, clearing the way for about $1.21 billion, of which
roughly $1 billion falls under the EFF and $210 million under the RSF. The
agreement remains subject to approval by the IMF Executive Board, after which
total disbursements under the two programmes would reach about $5.7 billion.
The inflation picture, however, kept investors
on edge. Headline CPI inflation stood at 10.3% year-on-year in September,
easing from 11.1% in August but well above the 5.8% recorded in September 2025,
with transport prices up 27.4% year-on-year on the back of costlier fuel. The
Finance Ministry projected October inflation in a range of 9.5% to 10.5%.
Against this backdrop, the Monetary Policy Committee met on October 26 and raised the policy rate by 50 basis points to 12%, effective October 27, in a nine-to-one vote. The SBP cited intensifying tensions in the Middle East, high global energy prices and rising inflation risks, noting that core inflation was around 8.4% and that a near-term resolution of the conflict appeared unlikely.
The central bank kept its FY27
GDP growth projection at 3.5% to 4.5%, reported foreign exchange reserves of
about $21.5 billion, or roughly three months of import cover, and said the
current account deficit of $874 million in the first quarter of FY27 should
keep the full-year gap within 0% to 1% of GDP.
For equities, a tightening cycle at a time of
slowing momentum is an uncomfortable mix. Higher rates raise the opportunity
cost of holding stocks against fixed-income alternatives, and the market’s
month-long retreat suggests investors had been positioning for this outcome
well before the announcement.
Sector
and Scrip-wise Movers
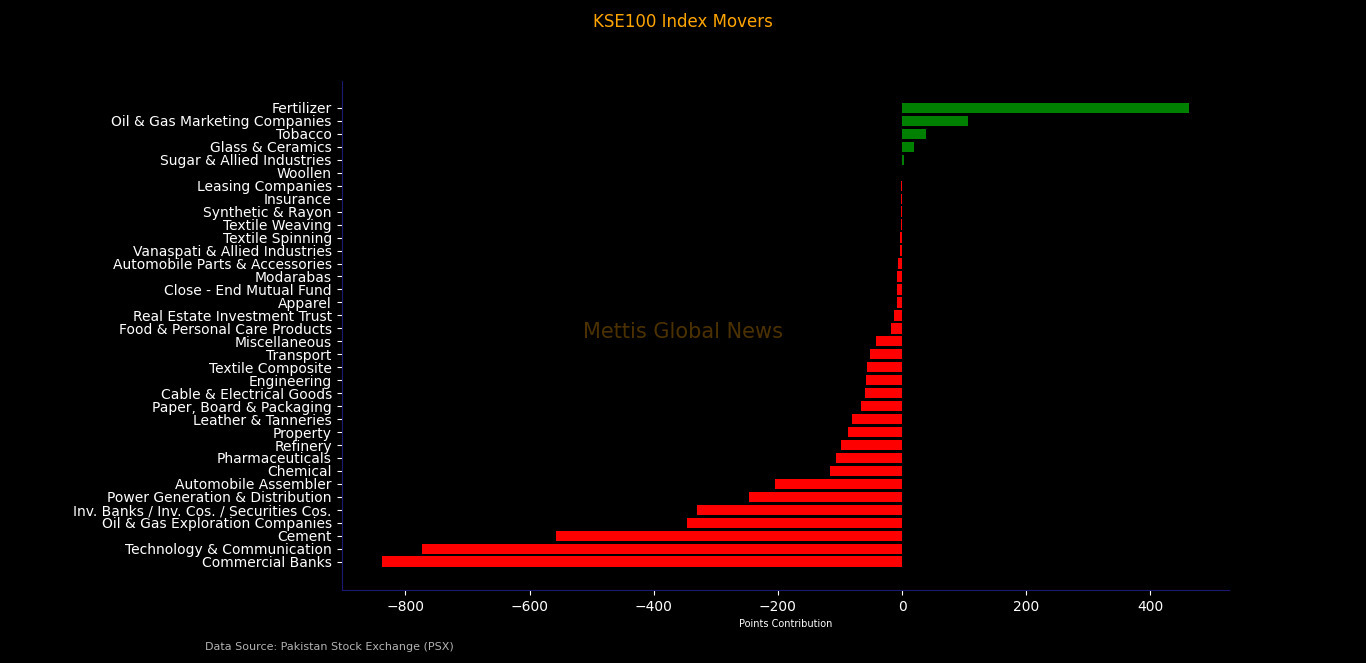
Most sectors in the index ended October in negative territory, and only 24 of the
100 constituents closed the month higher. Three heavyweight sectors did the
bulk of the damage: commercial banks dragged the index down by 838.04 points,
technology and communication by 773.68 points and cement by 557.60 points.
Together, they accounted for 2,169.32 points, or about 61% of the month’s net
decline.
They were followed by oil and gas exploration companies, which shaved off 345.84 points despite elevated international oil prices, investment banks and securities companies at 329.97 points, power generation and distribution at 245.97 points, and automobile assemblers at 204.23 points.
On the other side of the ledger, fertilizer was the clear standout with a positive contribution of 462.23 points, followed by oil and gas marketing companies at 106.95 points, tobacco at 38.44 points, glass and ceramics at 18.82 points, and sugar at 3.85 points.
Within banks, the divergence was sharp. Meezan
Bank (MEBL) was the single largest drag on the entire index at 422.18 points,
with HBL taking away another 302.63 points, UBL 105.06 points, Bank of Punjab
(BOP) 98.03 points and NBP 89.03 points. MCB Bank swam against the tide with a
positive contribution of 111.82 points, joined by Bank Al Habib (BAHL) at 54.03
points and Bank Alfalah (BAFL) at 45.84 points.
Lucky Cement (LUCK) was the second biggest
index loser at 371.89 points, with DG Khan Cement (DGKC) adding a further
103.39 points to cement’s woes. In technology, Systems Limited (SYS) cost the
index 353.21 points and PTCL (PTC) 318.26 points. Other notable laggards
included Sazgar Engineering (SAZEW) at 231.06 points, Engro Holdings (ENGROH)
at 229.62 points, Pakistan Petroleum (PPL) at 165.37 points, Fatima Fertilizer
(FATIMA) at 143.15 points, Attock Refinery (ATRL) at 123.88 points and Hub
Power (HUBC) at 111.91 points.
Leading the gainers by a wide margin was Fauji
Fertilizer Company (FFC), which single-handedly added 522.35 points to the
index, the largest positive contribution of any stock in October. Engro
Fertilizers (EFERT) followed with 128.00 points, Pakistan State Oil (PSO) with
118.59 points, MCB Bank with 111.82 points and Colgate-Palmolive (COLG) with
68.87 points.
_20261102063411591_89cb96.jpeg)
FIPI/LIPI
Foreign investors remained net sellers in
October, offloading equities worth $71.26 million, or Rs19.74 billion. The
selling came almost entirely from foreign corporates, whose net outflow reached
$82.31 million, or Rs22.80 billion, as they sold Rs26.61 billion worth of
shares against purchases of just Rs3.81 billion. Overseas Pakistanis partially
offset this with net buying of $11.10 million, or Rs3.07 billion, while foreign
individuals were marginal net sellers at $0.05 million.
Local investors absorbed the entire foreign
outflow, with net buying of $71.26 million. Other organisations led the way
with net purchases of $52.31 million, followed by individuals at $43.07
million, banks and DFIs at $15.90 million and companies at $15.61 million.
Individuals also dominated activity overall, accounting for Rs504.16 billion,
or about 74%, of local gross equity buying during the month.
Not all domestic institutions were buyers, however. Mutual funds were the largest local sellers with a net outflow of $43.75 million, suggesting fund managers were trimming equity exposure as rate risks mounted, while insurance companies sold a net $9.51 million and broker proprietary trading accounts a net $2.42 million. The shape of the flows points to a market increasingly propped up by retail and corporate money while professional fund managers, foreign and local alike, step back.
_20261102063423052_ab9ba7.jpeg)
Copyright Mettis Link News
Related News


| Name | Price/Vol | %Chg/NChg |
|---|---|---|
| KSE100 | 165,792.71 105.44M | -0.37% -616.54 |
| ALLSHR | 100,143.03 259.43M | -0.56% -564.74 |
| KSE30 | 48,716.93 24.35M | -0.63% -309.72 |
| KMI30 | 236,807.65 26.48M | -0.49% -1164.09 |
| KMIALLSHR | 64,647.80 152.30M | -0.58% -376.18 |
| BKTi | 45,479.23 6.71M | -1.01% -465.01 |
| OGTi | 33,519.39 2.92M | -0.38% -129.19 |
| Symbol | Bid/Ask | High/Low |
|---|
| Name | Last | High/Low | Chg/%Chg |
|---|---|---|---|
| BITCOIN FUTURES | 78,250.00 | 79,040.00 76,820.00 | 1280.00 1.66% |
| BRENT CRUDE | 110.44 | 112.41 109.40 | -2.99 -2.64% |
| RICHARDS BAY COAL MONTHLY | 134.00 | 0.00 0.00 | 0.75 0.56% |
| ROTTERDAM COAL MONTHLY | 148.05 | 0.00 0.00 | 0.30 0.20% |
| USD RBD PALM OLEIN | 1,182.50 | 1,182.50 1,182.50 | 0.00 0.00% |
| CRUDE OIL - WTI | 100.93 | 102.75 100.15 | -3.19 -3.06% |
| SUGAR #11 WORLD | 19.37 | 0.00 0.00 | 0.01 0.05% |
Chart of the Day
Latest News
Top 5 things to watch in this week
Pakistan Stock Movers
| Name | Last | Chg/%Chg |
|---|
| Name | Last | Chg/%Chg |
|---|