| Weekly Performance | ||
|---|---|---|
| Jul 31, 2020 | Jul 24, 2020 | |
| PKR InterBank | 166.9815 | 167.2606 |
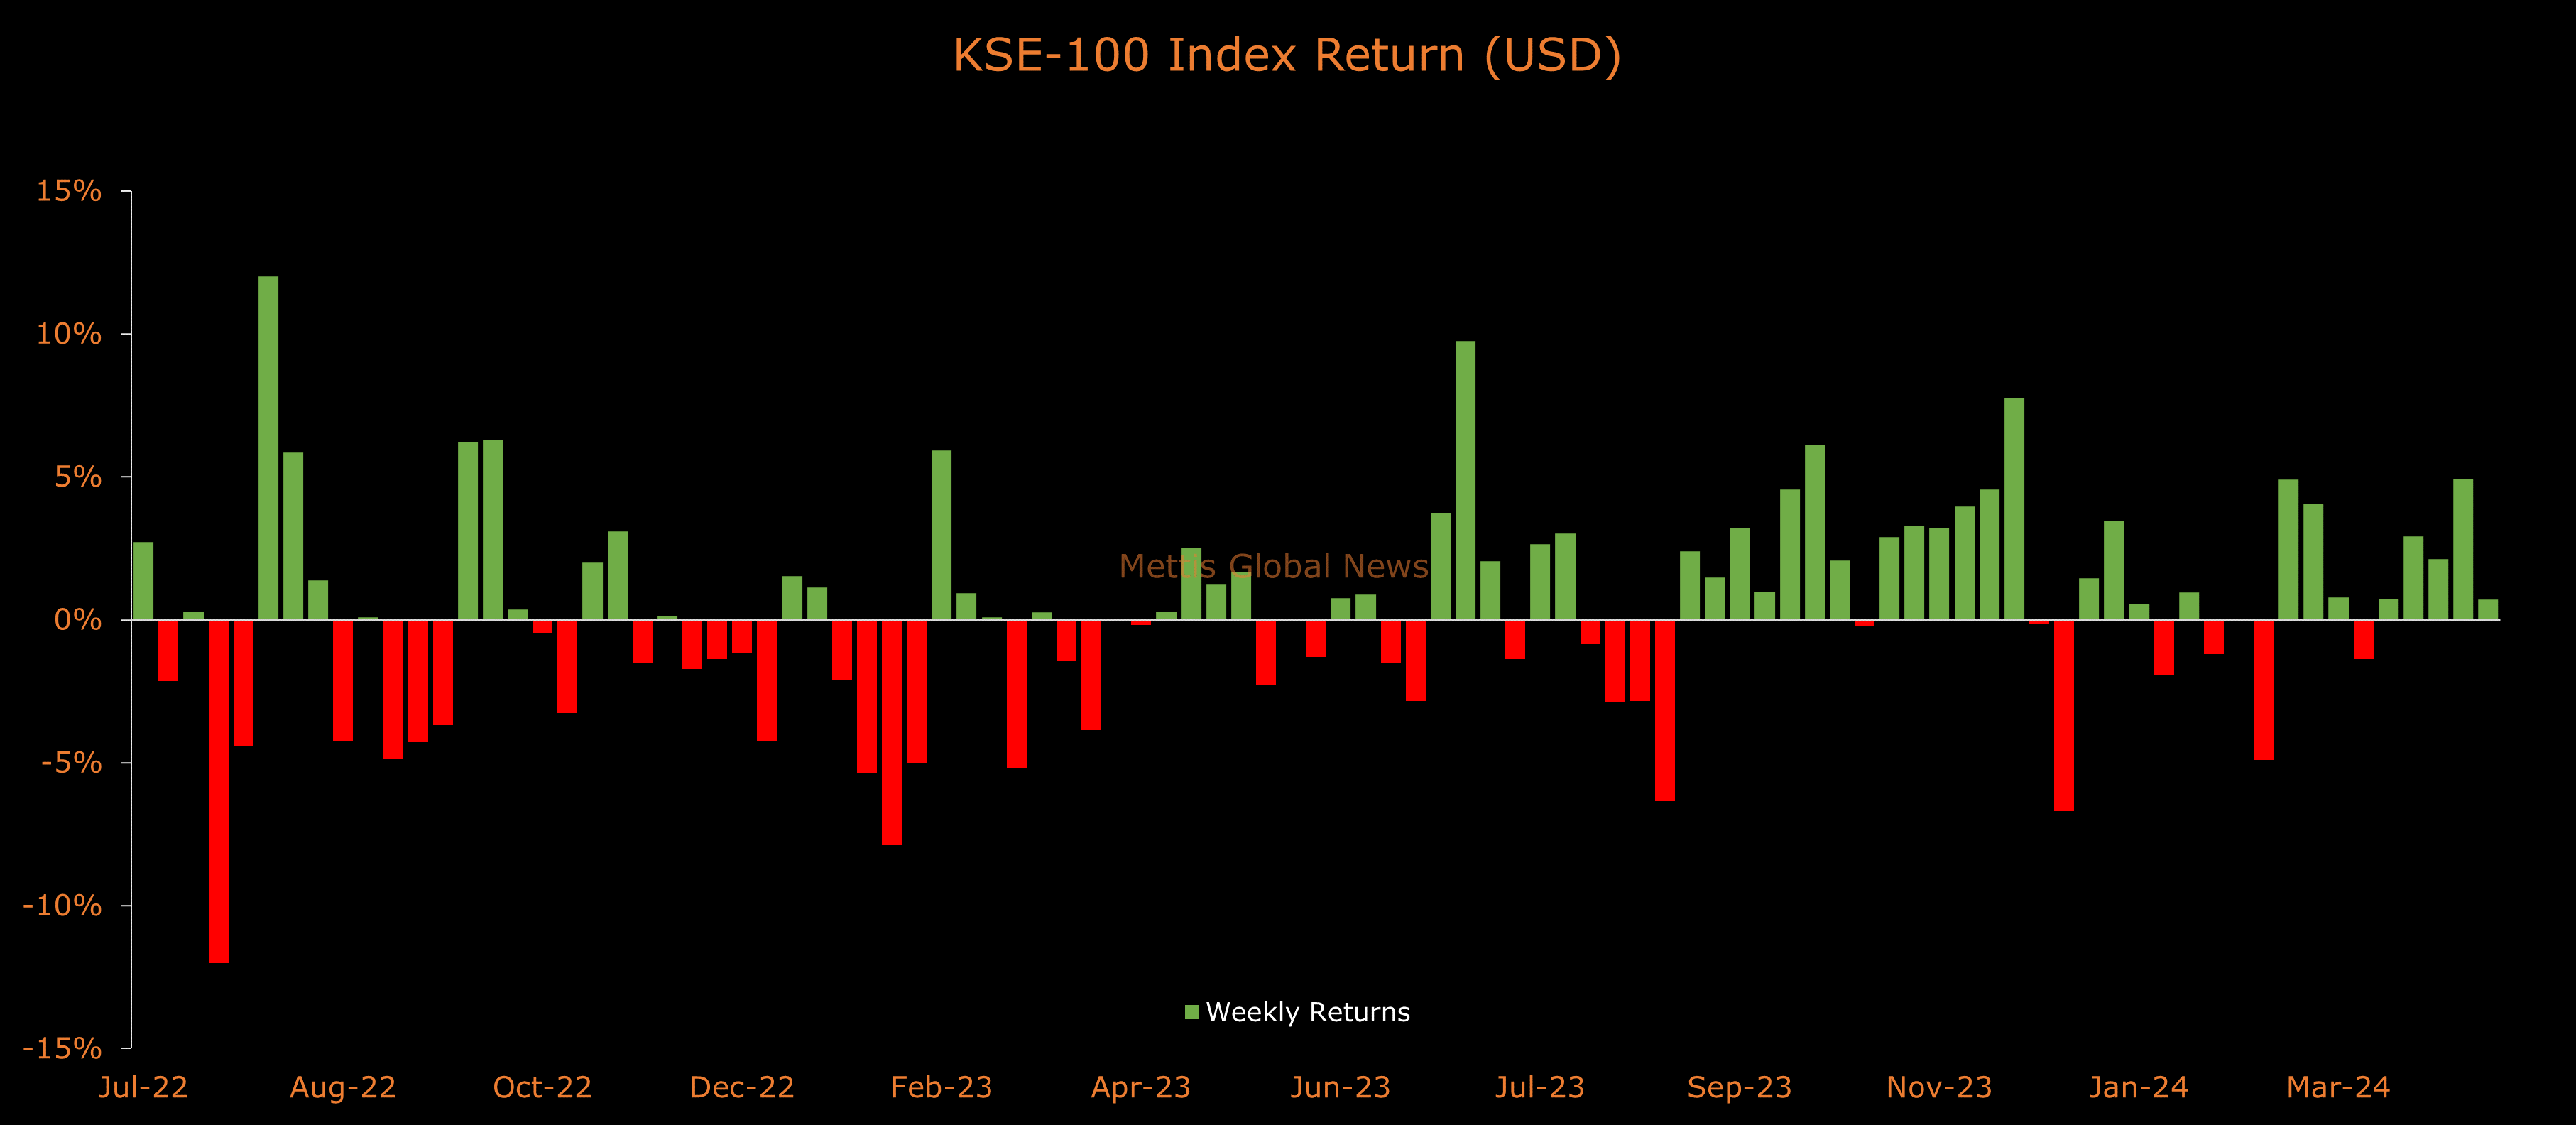
| KSE100 Index | 39,258.44 | 37,607.62 |
| Avg Daily Volume | 389,823,896 | 412,468,391 |
| Gold (Karachi) Rs/10 gm | 105,881 | 101,766 |
| KIBOR 6M | 7.09 | 6.69 |
| 10Y PIB | 9.19 | 8.97 |
| EUR | 1.1772 | 1.1656 |
| GBP | 1.308 | 1.2793 |
| CHF | 0.9129 | 0.9205 |
| JPY | 105.834 | 106.101 |
| GOLD | 1974.9 | 1900.6 |
| NY Light Crude | 40.25 | 41.29 |
| Open Market Rates | ||
| Jul 31, 2020 | Jul 24, 2020 | |
| USD | 167.50 | 168.25 |
| EUR | 197.49 | 196.26 |
| GBP | 219.44 | 215.42 |
| JPY | 1.5836 | 1.5867 |
| AED | 45.63 | 45.84 |
| SAR | 44.74 | 44.93 |
| SBP Data | ||
| T-Bill Auction Cutoff Yield | Jul 29, 2020 | Jul 15, 2020 |
| 3M | 6.9501 | 6.5598 |
| 6M | 7.0995 | 6.5700 |
| 12M | 7.1400 | 6.6001 |
| PIB Auction Cutoff Yield | Jul 21, 2020 | Jun 24, 2020 |
| 3Y | 7.3700 | 7.9700 |
| 5Y | 8.3700 | 8.4400 |
| 10Y | 8.9900 | 8.9900 |
| 15Y | 9.7500 | 9.9000 |
| 20Y | 10.4000 | 10.5100 |
| Interest Rate Corridor | Jun 26, 2020 | May 18, 2020 |
| SBP Policy Rate | 7.00 | 8.00 |
| SBP Reverse Repo Rate | 8.00 | 9.00 |
| SBP Repo Rate | 6.00 | 7.00 |
| Weekly Indicators | ||
| Jul 24, 2020 | Jul 17, 2020 | |
| SBP FX Reserves * | 11,975.60 | 12,121.60 |
| Bank FX Reseves * | 6,936.60 | 6,925.70 |
| Total FX Reserves * | 18,912.20 | 19,047.30 |
| Jul 29, 2020 | Jul 23, 2020 | |
| SPI (Combined Group) ** | 134.31 | 133.89 |
| Change – WoW (pct) | 0.31 | 0.21 |
| Change – YOY (pct) | 10.10 | 10.50 |
| Monthly Indicators | ||
| June | May | |
| Consumer Price Index (Base 2015-16) | 132.08 | 131.01 |
| Change – MOM (pct) | 0.82 | 0.32 |
| Change – YOY (pct) | 8.59 | 8.22 |
| WholeSale Price Index (Base 2015-16) | 135.80 | 136.23 |
| Change – MOM (pct) | -0.32 | -2.08 |
| Change – YOY (pct) | 0.93 | 1.50 |
| Sensitive Price Indicator (Base 2015-16) | 128.46 | 127.76 |
| Change – MOM (pct) | 0.55 | 1.70 |
| Change – YOY (pct) | 9.33 | 9.58 |
| June | May | |
| Exports * | 1,592.00 | 1,396.00 |
| Imports * | 3,715.00 | 2,863.00 |
| Trade Balance * | -2,123.00 | -1,467.00 |
| June | May | |
| Home Remittances * | 2,466.28 | 1,866.37 |
| June | May | |
| Total Foreign Investment * | 179.63 | 9.44 |
| Quarterly Indicators | ||
| Mar 31, 2020 | Dec 31, 2019 | |
| Pakistan's External Debt * | 109,948.92 | 110,719.33 |
| Annual Indicators | ||
| FY20 | FY19 | |
| GDP Growth Rate | -0.38 | 1.91 |
| Agriculture | 2.67 | 0.58 |
| Manufacturing | -0.27 | 5.43 |
| Commodity Sector | -0.05 | -0.90 |
| Services Sector | -0.59 | 3.75 |
| Trade Balance * (July – June) | -23,183.00 | -31,805.00 |
| Worker Remittances * (July – June) | 23,120.97 | 21,739.40 |
| Foreign Investment * (July – June) | 2,038.21 | -54.80 |
| Annual Inflation Rate % (July – June) | 10.74 | 6.80 |
| * Amount in USD Million | ||
Copyright Mettis Link News
Posted on: 2020-08-02T13:00:00+05:00
36076